Browse our archives by topic…
Power BI

Top Features of Notebooks in Microsoft Fabric
Lakehouse integration, built-in notebook resources, and collaboration features that set Microsoft Fabric notebooks apart from Jupyter and Databricks.

Reliably refresh Semantic Model from ADF or Synapse Pipelines
This post describes a pattern for reliably refreshing Power BI semantic models from Azure Data Factory or Azure Synapse Pipelines.

Reliably refreshing a Semantic Model from Microsoft Fabric Pipelines
This post describes a pattern for reliably refreshing Power BI semantic models from Microsoft Fabric Pipelines.

Learning from disaster: a Titanic Power BI report walkthrough
In Paul Waller's final, and posthumously published blog post, he takes you through a creative walk-through of the Titanic Power BI Report he created with Barry Smart.
How to Build Mobile Navigation in Power BI
This is follow guide to designing a mobile navigation in Power BI, covering form, icons, states, actions, with a view to enhancing report design & UI.
Power BI: using label encoded vs one-hot encoded data
Understand why label encoding is the preferred technique for encoding categorical data for analysis in Power BI over one-hot encoding.

Encoding categorical data for Power BI: Label vs one-hot
One-hot encoding and label encoding are two methods used to encode categorical data. Understand the specific advantages and disadvantages of these techniques.

Power BI Images That Pop: Intuitive, easy-to-maintain reports
Explore integrating icons, pictograms and images into Power BI in the optimal way to enhance the user experience and minimise effort required to build and maintain reports.
Why Power BI developers should care about TMDL
Power BI's adoption of TMDL improves the readability of the semantic model, enables version control and enhances collaboration and efficiency for developers.
Why Power BI developers should care about PBIR
Power BI's new PBIR format enhances collaboration, version control, and efficiency for developers. Learn key benefits and future implications.

Why Power BI developers should care about Power BI projects (PBIP)
Power BI Projects are a game changer for teams building reports; offering a source-control friendly format, CI/CD support, and the ability to edit in a code editor.
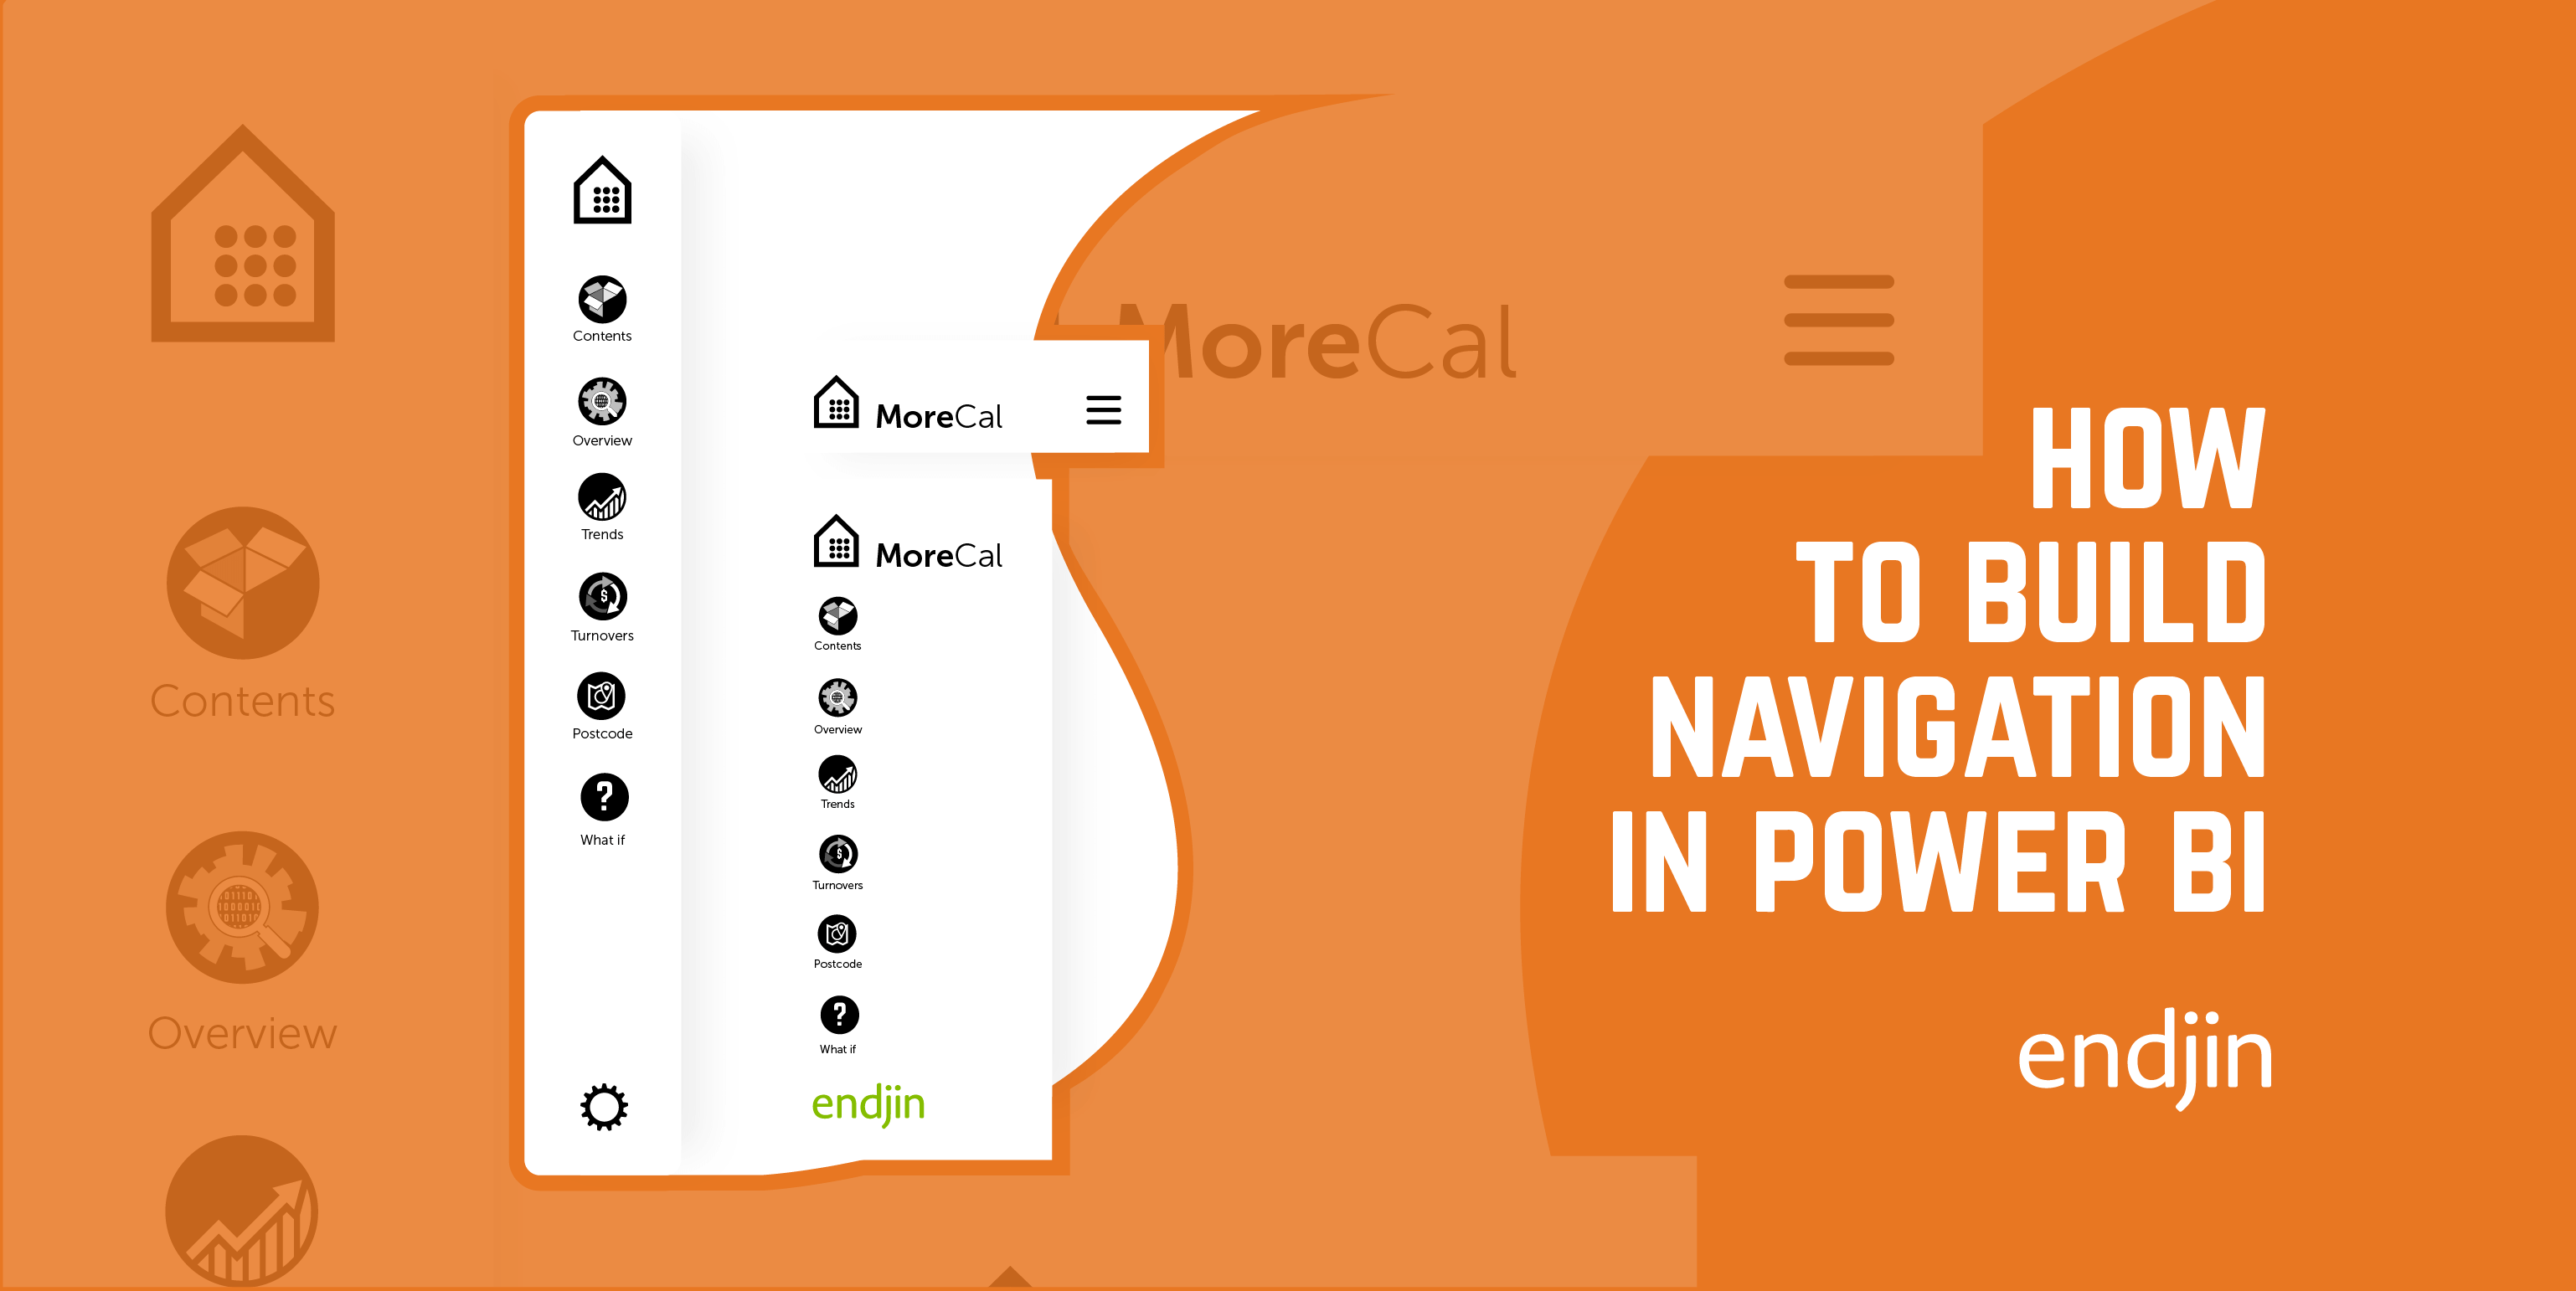
How to Build Navigation into Power BI
Explore a step-by-step guide on designing a side nav in Power BI, covering form, icons, states, actions, with a view to enhancing report design & UI.
Star Schemas: unleashing value from data in Microsoft Fabric
Ralph Kimball's 1996 Star Schema principles still underpin modern cloud-native analytics — why dimensional modelling unlocks value from data in Microsoft Fabric.

Microsoft Fabric: Announced
Microsoft Fabric unifies Power BI, Data Factory & Data Lake on Synapse infrastructure, reducing cost & time while enabling citizen data science.

Intro to Microsoft Fabric
Microsoft Fabric unifies data & analytics, building on Azure Synapse Analytics for improved data-level interoperability. Explore its offerings & pros/cons.
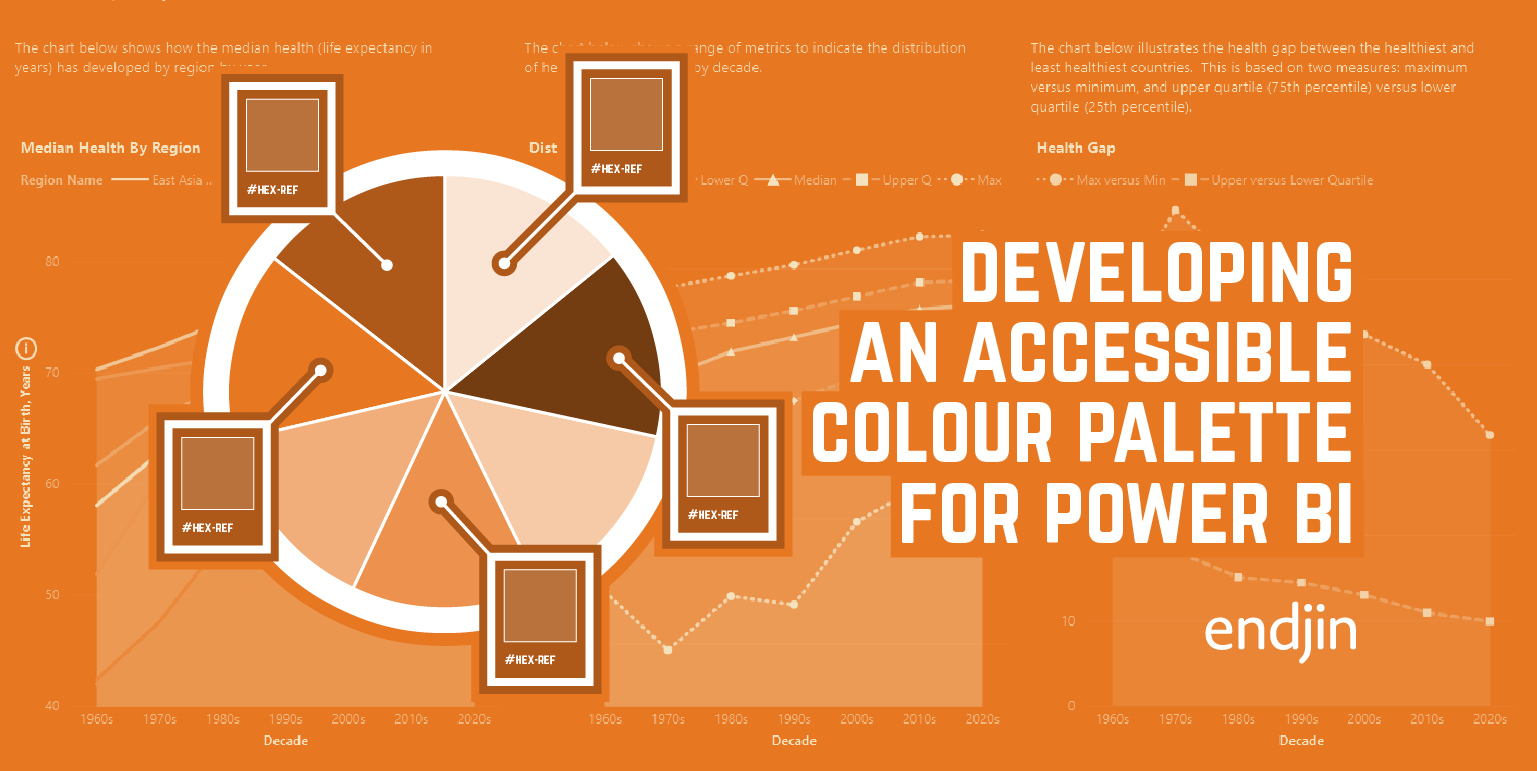
How to develop an accessible colour palette for Power BI
Explore how we developed an accessible color palette for Power BI reports, considering color vision deficiency and data visualization.
Big Data LDN: highlights and how to survive your first data conference
Highlights from Big Data LDN 2022, covering Data Mesh debates, data quality and creation vs extraction, modern data stack terminology, women in data talks, and tips for surviving your first in-person conference.
EVALUATEANDLOG in DAX
DAX has never had real debugging capability until EVALUATEANDLOG. This hidden function prints intermediate values from any DAX expression, letting you see exactly how your measures are evaluated.
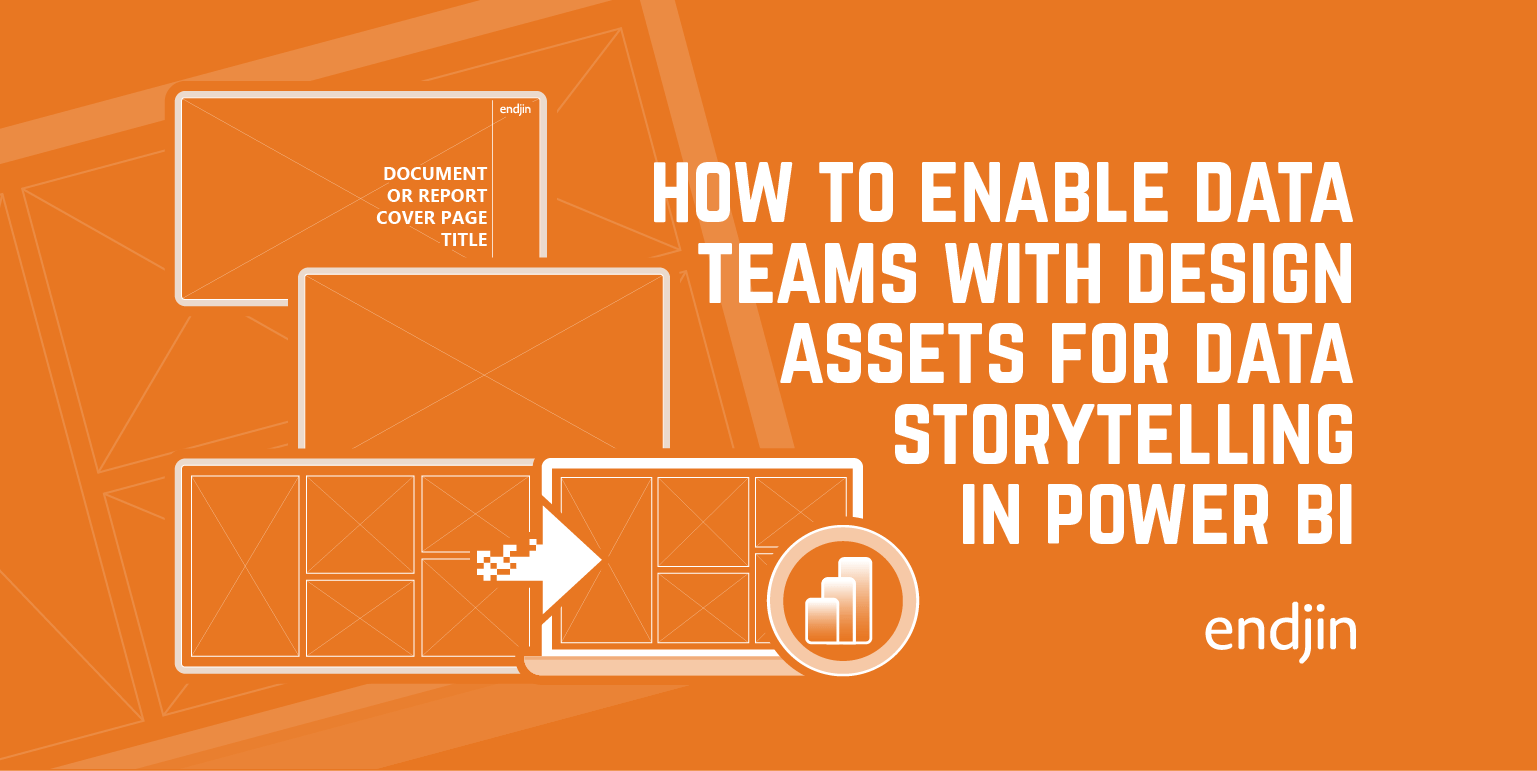
Design assets for impactful data storytelling in Power BI
In this post we will talk through how to expand on a data team's creative skillset, without access to specialist photo editing software such as Photoshop or Illustrator.
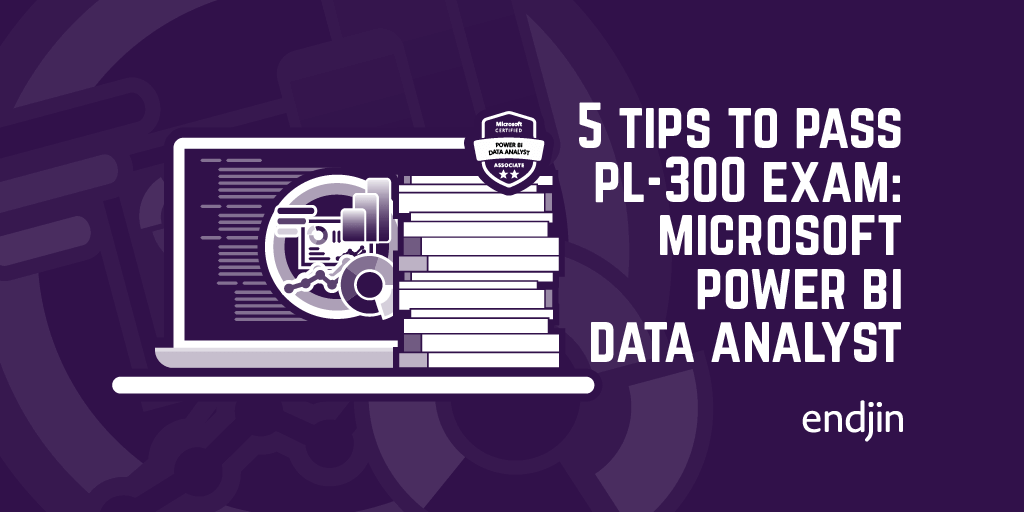
5 tips to pass the PL-300 exam: Microsoft Power BI Data Analyst
I recently passed the PL-300 - Power BI Data Analyst exam. Here are some tips to prepare for it that I found useful!

Performance Optimisation Tools for Power BI
Optimise Power BI report performance with analyzer tools. Discover essential techniques for efficient report development in this blog post.
Insight Discovery (part 1) – why do data projects often fail?
Why traditional bottom-up data warehouse projects so often deliver compromised platforms — and how a top-down, action-oriented approach changes the outcome.
Context Transition in DAX
How CALCULATE silently turns a row context into a filter context in DAX — and why context transition prevents surprises in calculated columns and measures.
CALCULATE in DAX
CALCULATE is the only DAX function that can change filter context in Power BI. Jess explains how it works, its syntax, and how filter propagation flows.
RELATED and RELATEDTABLE in DAX
How DAX's RELATED and RELATEDTABLE functions navigate one-to-many relationships in Power BI — with a Customer/Sales example showing row-context behaviour.

Filtering unrelated tables in Power BI
Explore filtering fact tables with Star Schemas and learn a clean method for filtering dimension tables by another dimension.
Dynamically switch Power BI measures with Field Parameters
Power BI's Field Parameters feature lets users toggle between measures in a single visual with no advanced modelling. Here's how to set it up, plus a DAX-based workaround for when you need more control.
Table Functions in DAX: DISTINCT
Explore DAX's DISTINCT table function in Power BI — how it returns unique values of a column in the current filter context, with worked Sales and Product examples.

Table Functions in DAX: FILTER and ALL
FILTER and ALL are the two most common table functions in DAX, controlling how filter context flows through Power BI to drive dynamic measures and calculations.
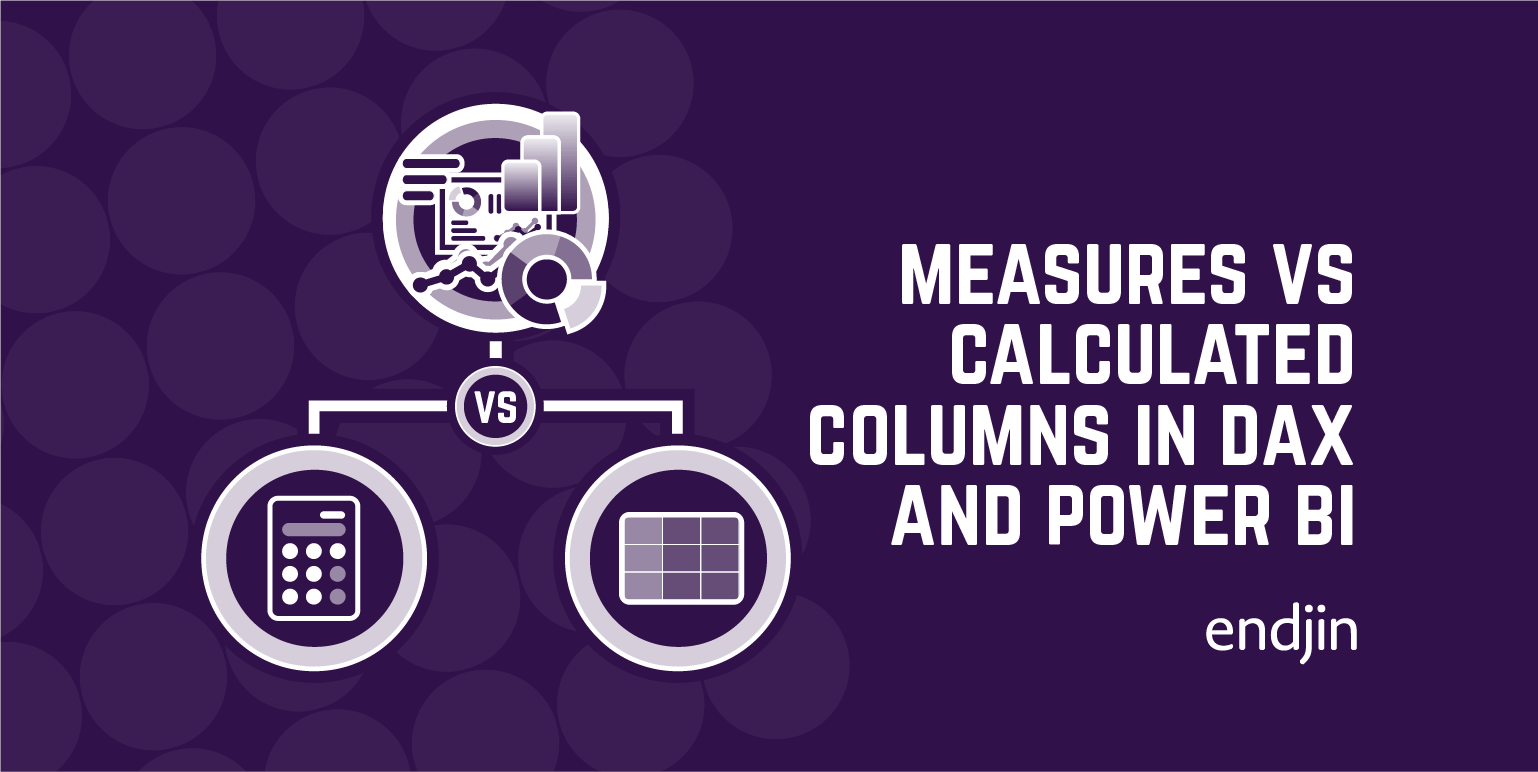
Measures vs Calculated Columns in DAX and Power BI
Explore DAX & Power BI differences between measures & calculated columns, and learn when to use each in this informative blog post.
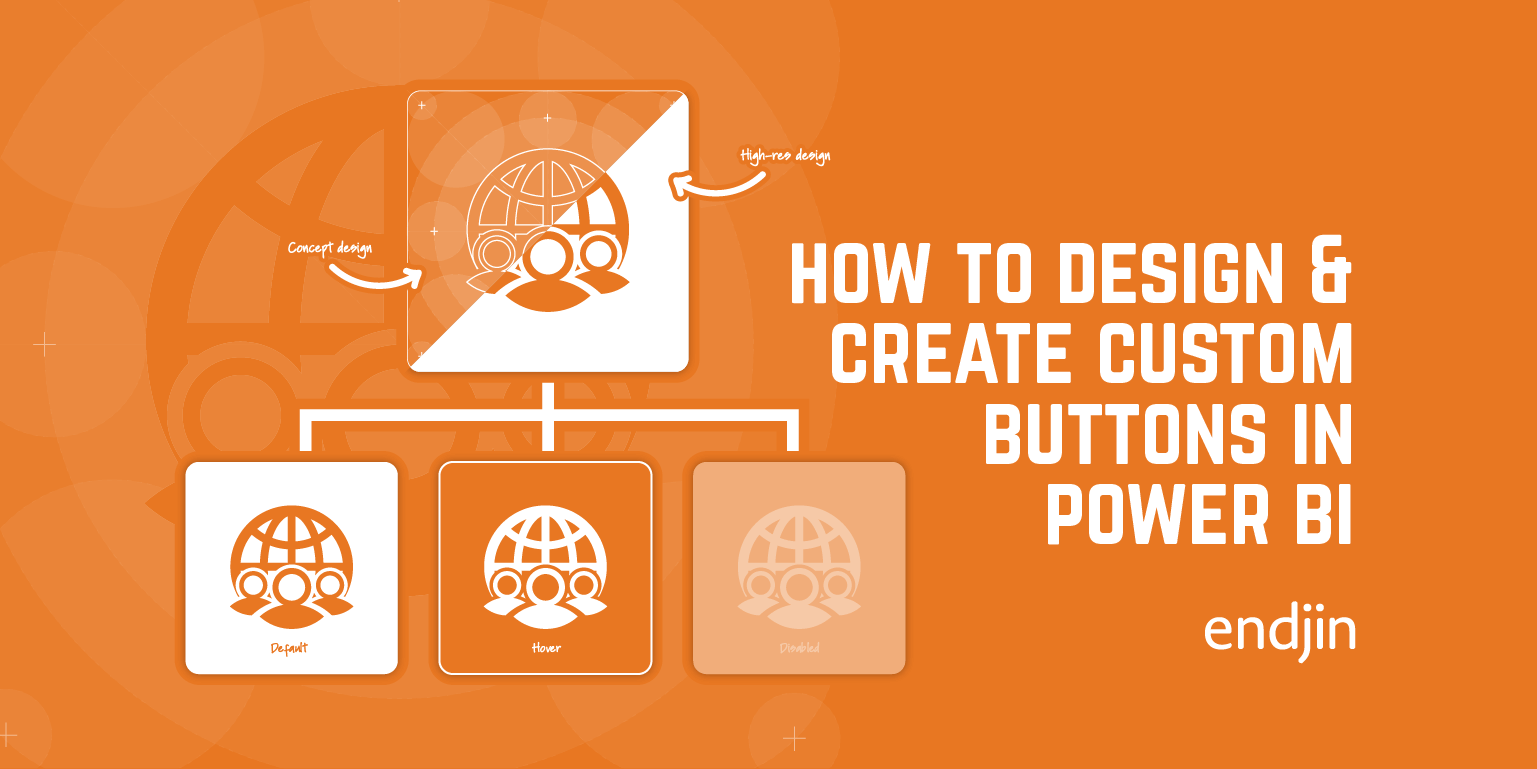
How to Create Custom Buttons in Power BI
Explore a step-by-step guide on designing custom buttons in Power BI, covering shape, form, icons, states, actions, and enhancing report design & UI.
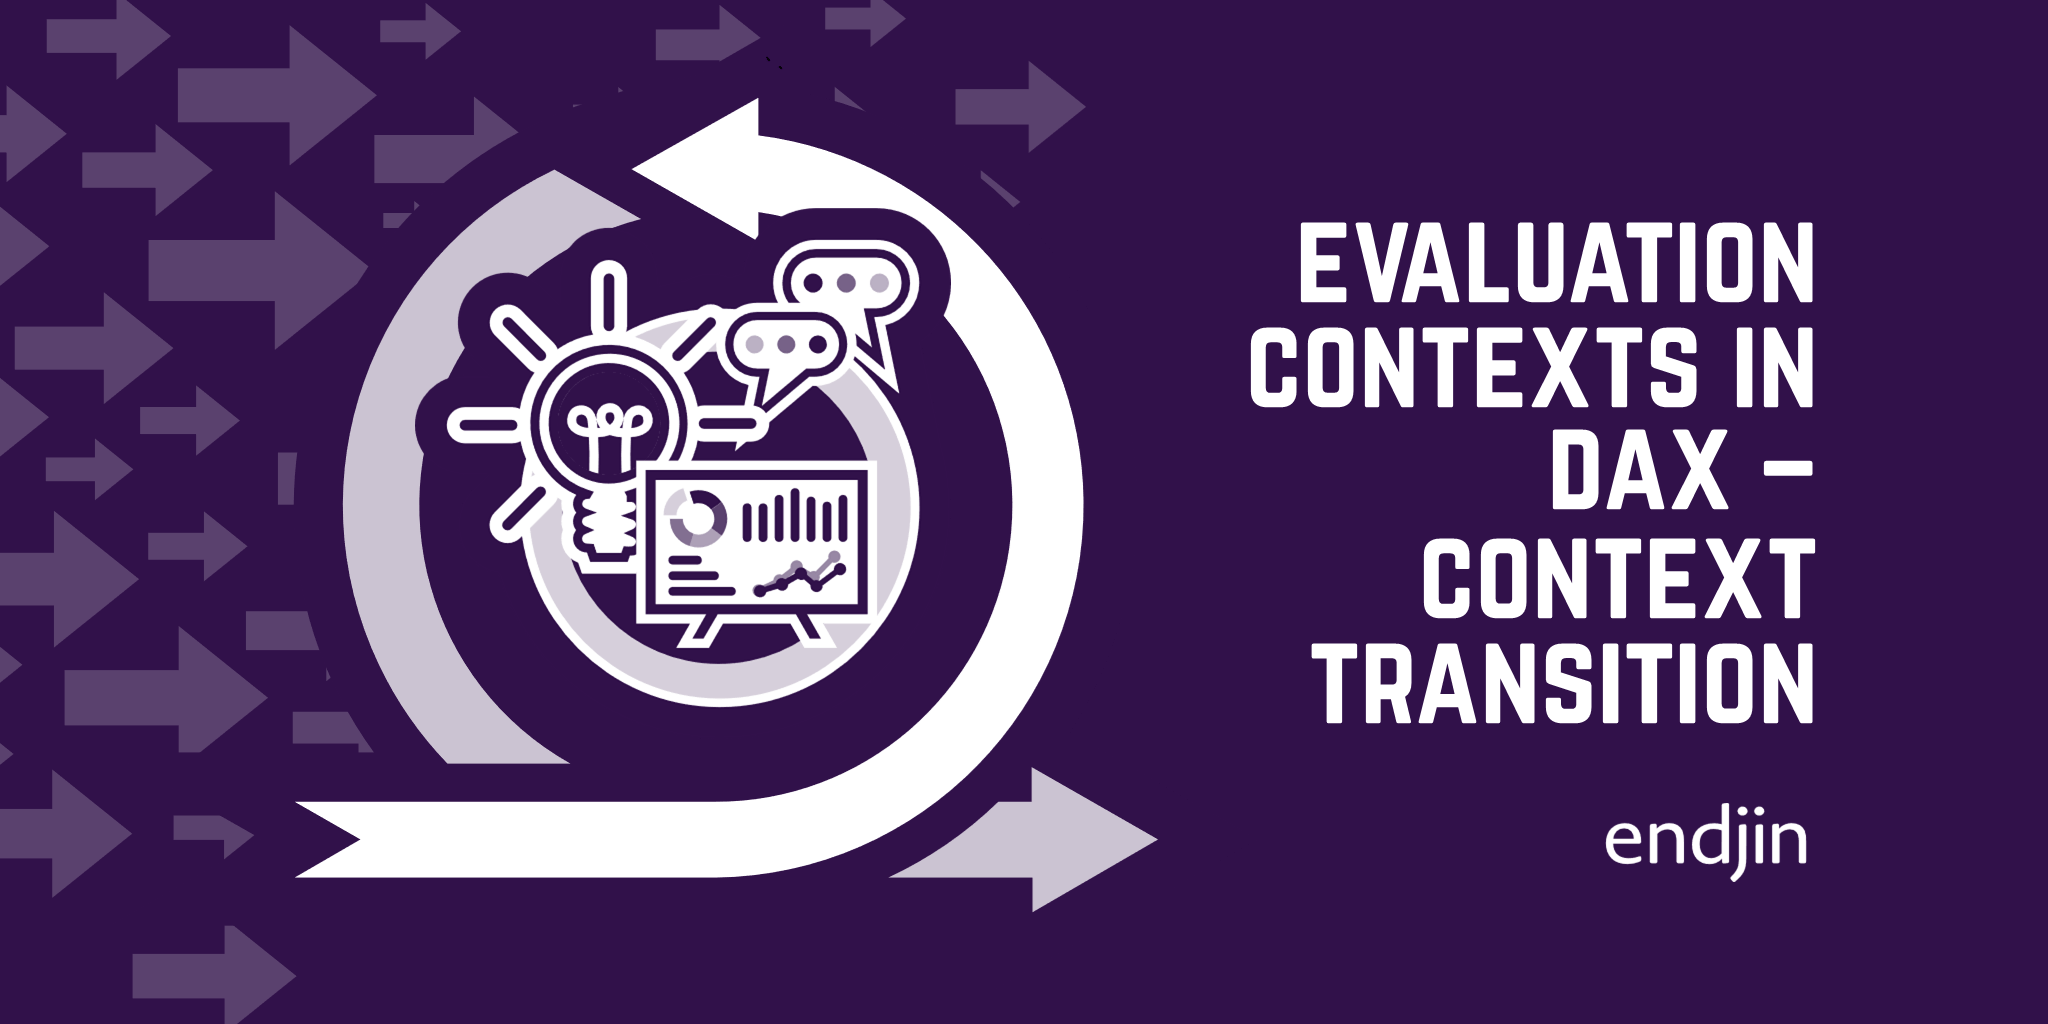
Evaluation Contexts in DAX - Context Transition
In this third and final part of this series, we learn how CALCULATE performs Context Transition when used inside of a filter context.

Evaluation Contexts in DAX - Relationships
After learning about the two different types of evaluation contexts in our previous post, we now talk about table relationships and how these interact with the filter and row contexts to condition the output of our DAX code.
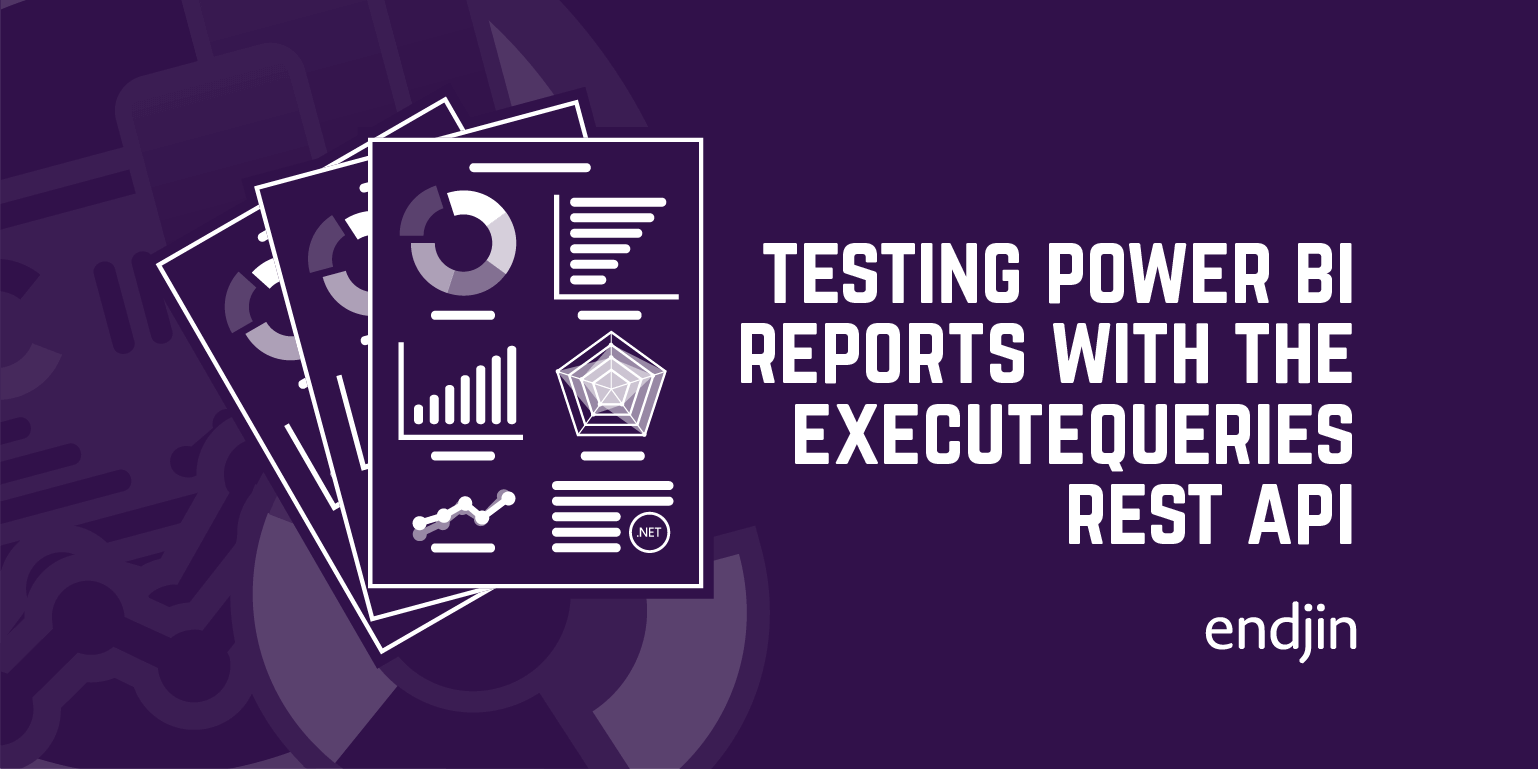
Testing Power BI Reports with the ExecuteQueries REST API
Explore DAX queries for scenario-based testing in Power BI reports to ensure data model validity, rule adherence, and security maintenance.

How to Build a Branded Power BI Report Theme
Explore translating a company's brand into Power BI reports and extending their visual identity to include the Power BI platform.
Why you should care about the Power BI ExecuteQueries API
Explore the benefits of Power BI's new ExecuteQueries REST API for developers in tooling, process, and integrations.

Generating custom themes in Power BI – A designer's perspective
Explore custom Power BI themes and learn tips for styling reports, pushing beyond your comfort zone for enhanced data visualization.
Azure Synapse SQL Serverless: connect Data Lake and Power BI
TL;DR - Using Azure Synapse SQL Serverless, you can query Azure Data Lake and populate Power BI reports across multiple workspaces.
Power BI deployment pipelines: enabling DevOps for analytics
Power BI deployment pipelines manage collaboration, change management, and testing of reports, enabling DevOps for analytics solutions.
Update credentials for on-prem Power BI data source via PowerShell
Learn to automate Power BI data source credential updates using RSA-OAEP encryption and .NET SDK helper classes for on-premises data sources.
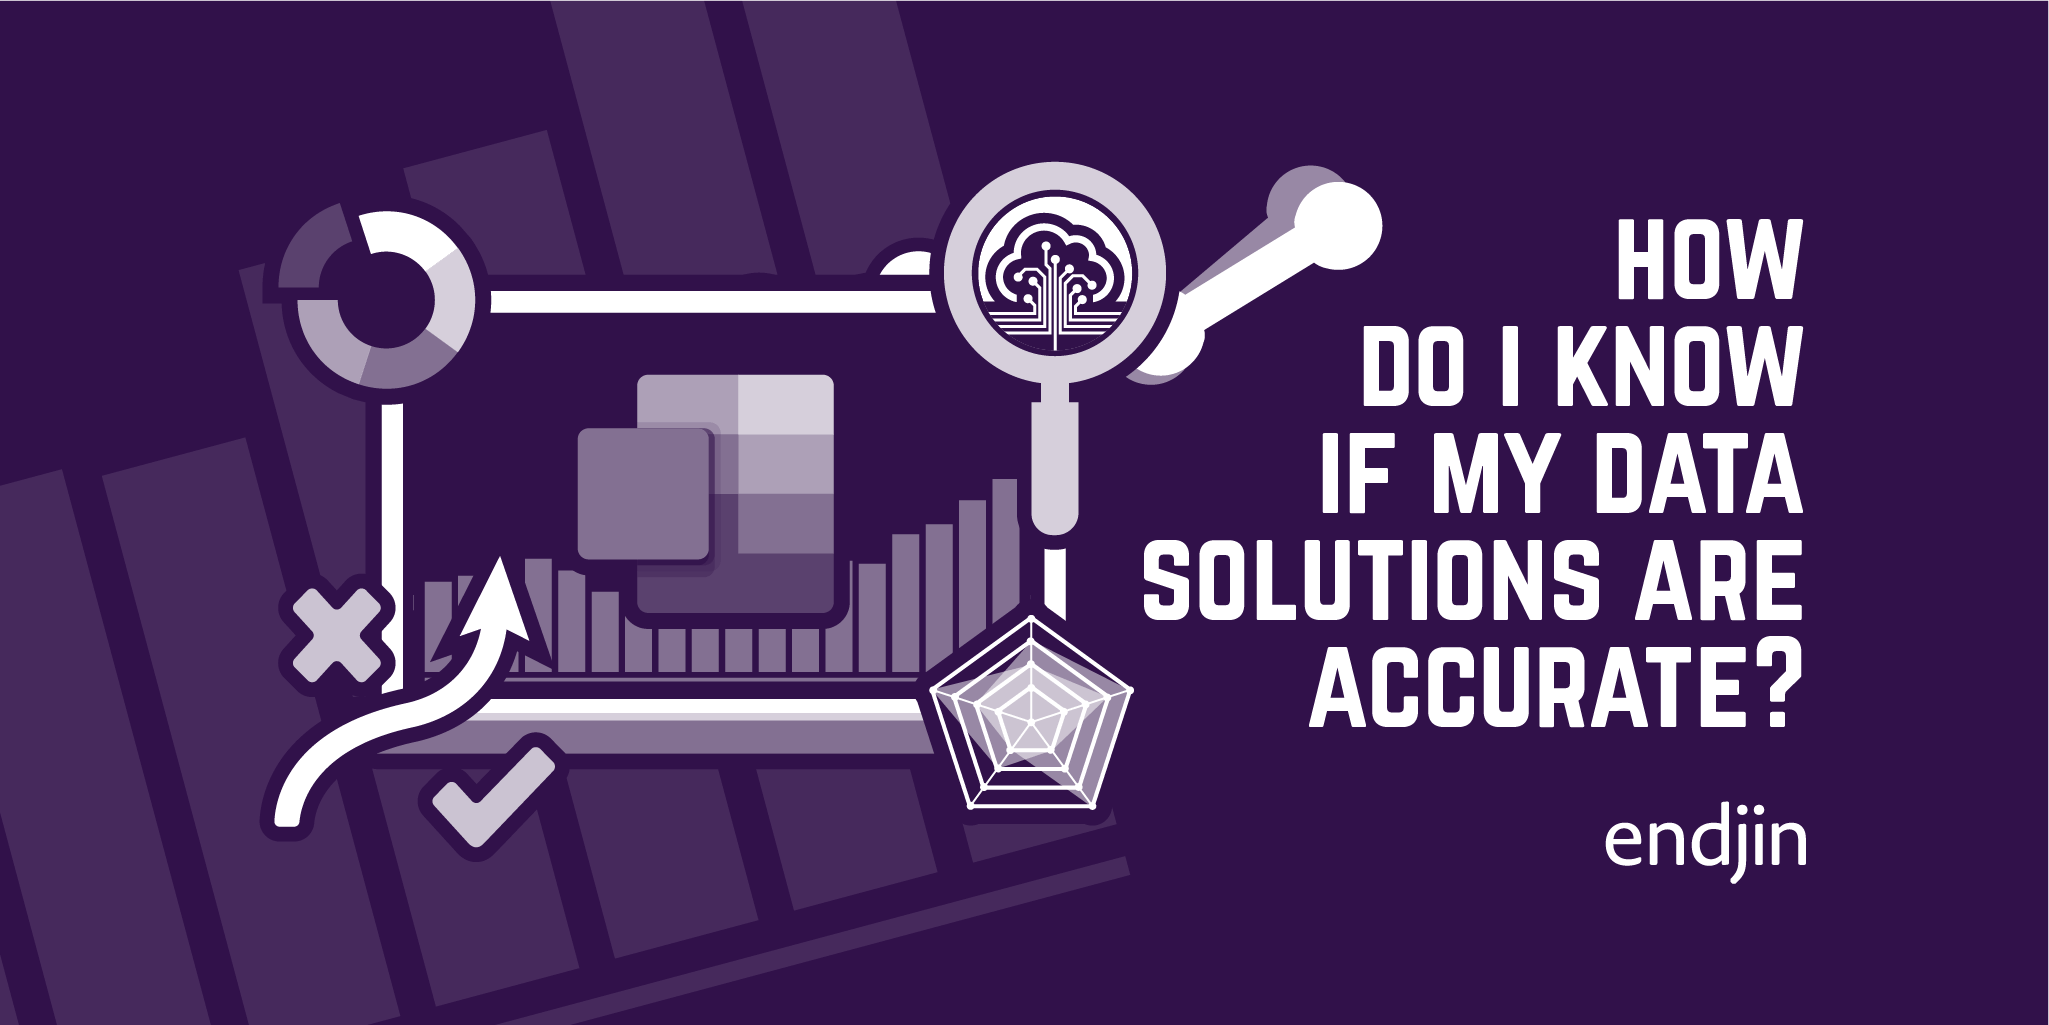
How do I know if my data solutions are accurate?
Data insights are useless, and even dangerous (as we've seen recently at Public Health England) if they can't be trusted. So, the need to validate business rules and security boundaries within a data solution is critical. This post argues that if you're doing anything serious with data, then you should be taking this seriously.
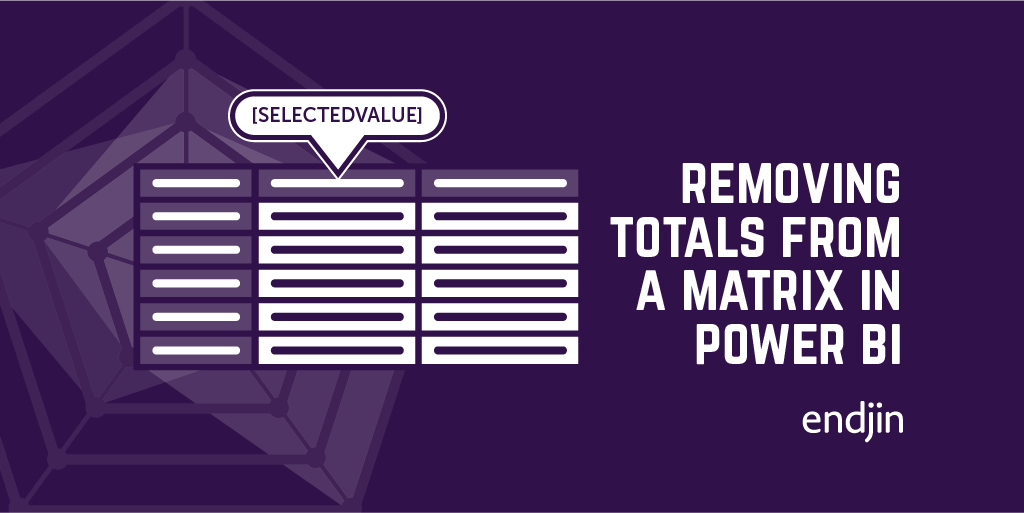
Quick tip – Removing totals from a matrix in Power BI
A quick Power BI tip: remove unwanted column summarisation from a matrix by replacing the column with a SELECTEDVALUE measure — with a worked example.
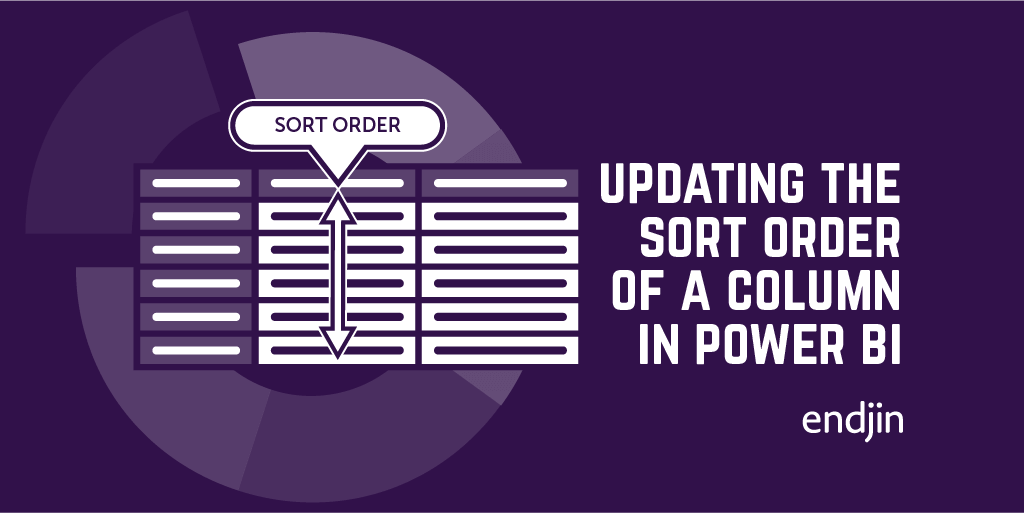
Quick tip: updating Power BI column sort order without circular refs
Power BI columns sort alphabetically by default — putting 'February' before 'January'. Fix it with a lookup table and a calculated column for custom sort order.
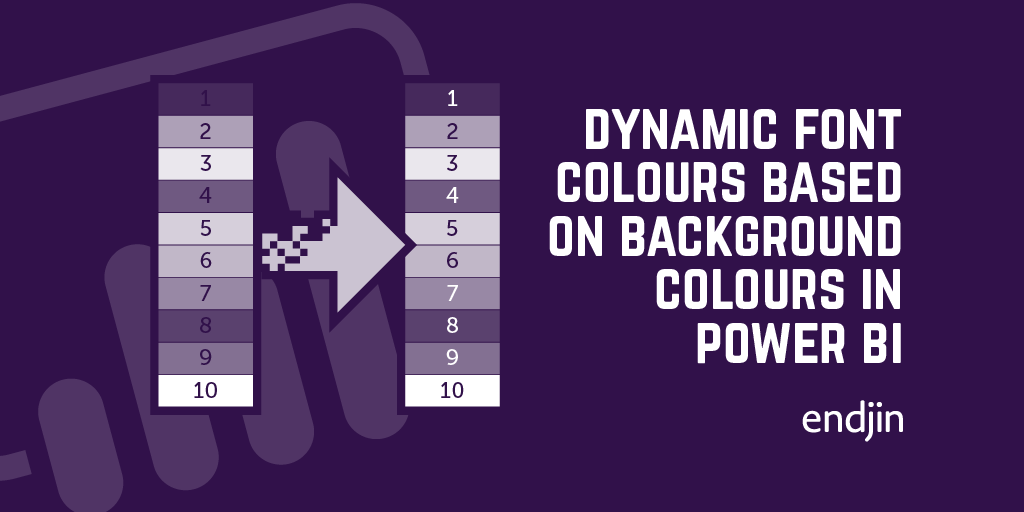
Picking contrasting font colours in Power BI tables
Boost Power BI report readability with dynamic font colors for diverse backgrounds, ensuring clear text display and enhanced accessibility.
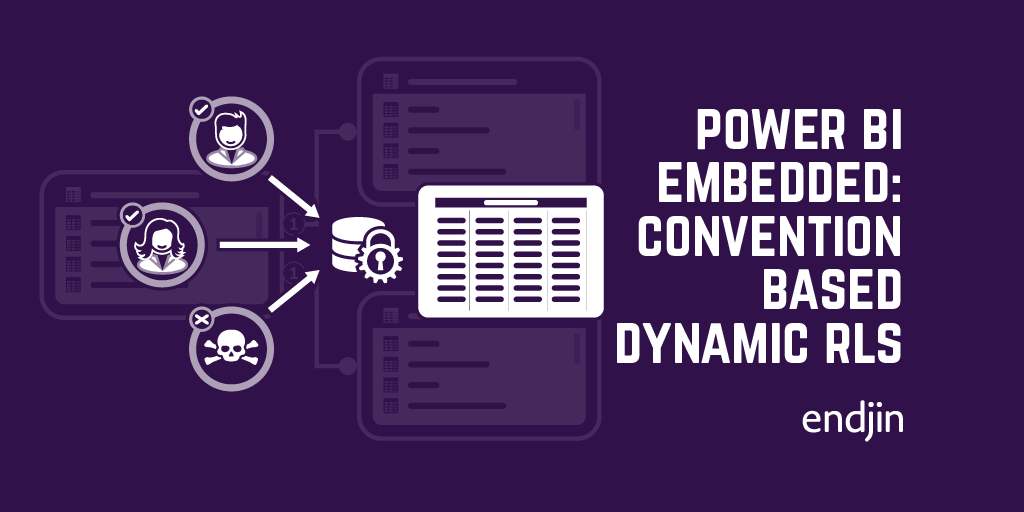
Power BI Embedded: Convention-based dynamic Row-level Security
Explore Power BI Embedded for ISVs, using JavaScript library for personalization, Row-level Security, and modifying Embed Requests for data filtering.
How can I improve my data model in Power BI?
Explore how to configure model properties in Power BI for enhanced discoverability and improved data visualisation support.
Why Power BI developers should care about the read/write XMLA endpoint
Whilst "read/write XMLA endpoint" might seem like a technical mouthful, its addition to Power BI is a significant milestone in the strategy of bringing Power BI and Analysis Services closer together. As well as closing the gap between IT-managed workloads and self-service BI, it presents a number of new opportunities for Power BI developers in terms of tooling, process and integrations. This post highlights some of the key advantages of this new capability and what they mean for the Power BI developer.
Learning DAX and Power BI – CALCULATE
This is the final blog in a series about DAX and Power BI. This post focuses on the CALCULATE function, which is a unique function in DAX. The CALCULATE function has the ability to alter filter contexts, and therefore can be used to enable extremely powerful and complex processing. This post covers some of the most common scenarios for using CALCULATE, and some of the gotchas in the way in which these different features interact!
Testing Power BI Reports using SpecFlow and .NET
Ensure Power BI report quality by connecting to tabular models, executing scenario-based specs, and validating data, business rules, and security.
Data modelling with Power BI - Loading and shaping data
Explore data modelling in Power BI, including loading, shaping, and enhancing data. Learn key steps and practical examples.
Learning DAX and Power BI – Related Tables and Relationships
This is the sixth blog in a series about DAX and Power BI. This post focuses on relationships and related tables. These relationships allow us to build up intricate and powerful models using a combination of sources and tables. The use of relationships in DAX powers many of the features around slicing and page filtering of reports.
Testing Power BI Dataflows using SpecFlow and the Common Data Model
Ensure reliable insights with endjin's automated quality gates for validating Power BI Dataflows in complex solutions.
Learning DAX and Power BI – Table Functions
This is the fifth blog in a series on DAX and Power BI. This post focuses on table functions. In DAX, table functions return a table which can then be used for future processing. This can be useful if, for example, you want to perform an operation over a filtered dataset. Table functions, like most functions in DAX, operate under the filter context in which they are applied.
Learning DAX and Power BI - Aggregators
This is the fourth blog in a series about DAX and Power BI. We have so far covered filter and row contexts, and the difference between calculated columns and measures. This post focuses on aggregators. We cover the limitations of the classic aggregators, and demonstrate the power of the iterative versions. We also highlight some of the less intuitive features around how these functions interact with both filter and row contexts.
Power BI Dataflow refresh polling
There's no obvious API endpoint for Power BI Dataflow refresh history, unlike Datasets. Here's how to get it programmatically.
Azure Analysis Services: update calculated column expression from .NET
Learn how to update Azure Analysis Services model schemas in .NET apps using AMO SDK for user-driven analysis.
Learning DAX and Power BI – Calculated Columns and Measures
Dive into DAX and Power BI in our blog. Learn about calculated columns, measures, and their use in complex visuals.
Learning DAX and Power BI – Row Contexts
Here is the second blog in a series around learning DAX and Power BI. This post focuses on row contexts, which are used when iterating over the rows of a table when, for example, evaluating a calculated column. Row contexts along with filter contexts underpin the basis of the DAX language. Once you understand this underlying theory it is purely a case of learning the syntax for the different operations which are built on top of it.
Azure Analysis Services: Process an async model refresh from .NET
Learn to use Azure Analysis Services in custom apps via REST API in .NET for efficient async model refreshes.
Azure Analysis Services: How to execute a DAX query from .NET
Explore endless possibilities with dynamic DAX queries in C# for Azure Analysis Services integration in custom apps using the provided code samples.
British Science Week: inspiring the next generation of data scientists
The theme of this year's British Science Week (6 - 15 March 2020) is "Our Diverse Planet". We'll be getting involved by speaking to school children about the work we've been doing with Oxfordshire-based OceanMind (part of the Microsoft AI for Good programme) to help them combat illegal fishing, hopefully inspiring some of the next generation of data scientists!
Azure Analysis Services: query all measures in a model from .NET
Explore .NET querying methods for integrating Azure Analysis Services beyond data querying into dynamic UIs and APIs.
Azure Analysis Services: How to open a connection from .NET
Learn to integrate Azure Analysis Services in apps by establishing server connections. Follow this guide with code samples for essential scenarios.
Azure Analysis Services integration: .NET, REST APIs and PowerShell
Explore Azure Analysis Services in custom apps using SDKs, PowerShell cmdlets & REST APIs. Learn to choose the right framework in this guide.
Azure Analysis Services: 8 reasons to integrate in custom apps
Azure Analysis Services isn't just for Power BI dashboards. Here are eight reasons you might want to integrate it directly into a custom application.

AI for Good Hackathon
Endjin attended Microsoft's AI for Good hackathon at the IET in London, highlighting the potential of tech to amplify good deeds.
Building a secure data solution using Azure Data Lake Store (Gen2)
In this blog we discuss building a secure data solution using Azure Data Lake. Data Lake has many features which enable fine grained security and data separation. It is also built on Azure Storage which enables us to take advantage of all of those features and means that ADLS is still a cost effective storage option!This post runs through some of the great features of ADLS and runs through an example of how we build our solutions using this technology!

Endjin is a Snowflake Partner
Snowflake is a cloud native data warehouse platform, that enabled data engineering, data science, data lakes, data sharing and data warehousing. Endjin are very excited to announce our partnership.

The Power BI Weekly newsletter has published its fifth edition!
Power BI Weekly's fifth edition is out. Subscribe for our free curated weekly summary of Microsoft Power BI news, product updates, and community blog posts.
Exploring Azure Data Factory - Mapping Data Flows
Mapping Data Flows are a relatively new feature of ADF. They allow you to visually build up complex data transformation sequences. This can aid in the streamlining of data manipulation and ETL processes, without the need to write any code! This post gives a brief introduction to the technology, and what this could enable!
Announcing Power BI Weekly!
Power BI has become more successful than anyone anticipated. We've decided to spin out the Power BI category from the Azure Weekly Newsletter into it's own publication - Power BI Weekly.
CALENDAR vs CALENDARAUTO for year-on-year date tables
Performing Power BI date table generation with CALENDAR & CALENDARAUTO functions. Learn key considerations for time-intelligence calculations in reports.

How we set up daily Azure spending alerts and saved $10k
We set up daily Azure spending alerts with Azure Cost Management, catching cost spikes within 24 hours and saving over $10,000 versus monthly billing.
Power BI DirectQuery report with multiple SQL DBs via Elastic Query
Learn to build a Power BI dashboard using DirectQuery and ElasticQuery across multiple databases with Alice Waddicor.

How to use Power BI Embedded with AspNetCore
Add a Power BI Embedded report to ASP.NET Core without an SDK: drop-in IHtmlHelper extensions, tips on PowerBI.js bundling, and the missing PowerBI.MVC.
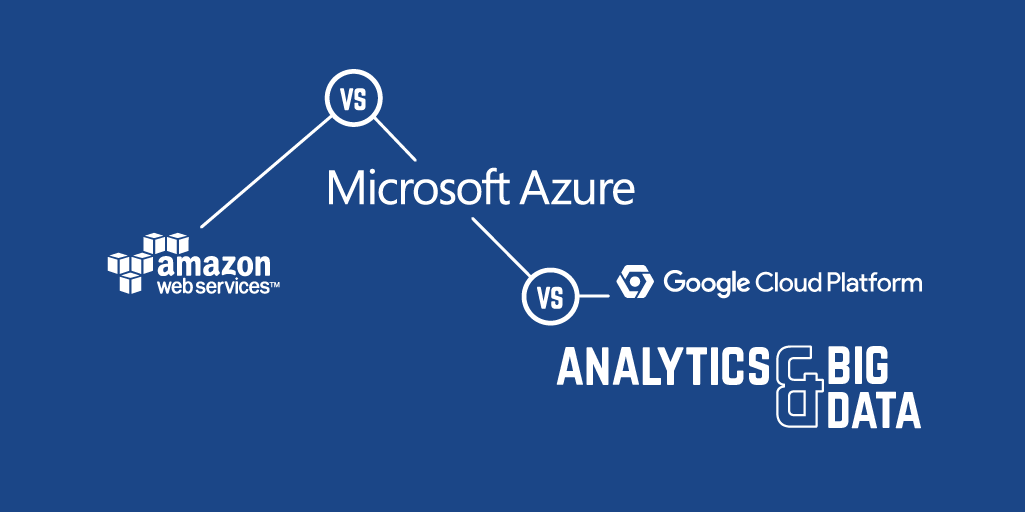
AWS vs Azure vs Google Cloud Platform - Analytics & Big Data
This post compares analytics and big data services across AWS, Azure, and Google Cloud Platform, covering data processing, machine learning, streaming analytics, and visualization offerings.
Embracing Disruption - Financial Services and the Microsoft Cloud
We have produced an insightful booklet called "Embracing Disruption - Financial Services and the Microsoft Cloud" which examines the challenges and opportunities for the Financial Service Industry in the UK, through the lens of Microsoft Azure, Security, Privacy & Data Sovereignty, Data Ingestion, Transformation & Enrichment, Big Compute, Big Data, Insights & Visualisation, Infrastructure, Ops & Support, and the API Economy.
Visualise your Azure Table Storage data with Power BI
You don't need to be a data scientist to surface insights from Azure Table Storage. Connect Power BI directly, import the data, and start visualising trends.