Star Schemas: unleashing value from data in Microsoft Fabric


TLDR; For many, the term Star Schema implies traditional large scale business intelligence projects and therefore it carries negative connotations of "enterprise monoliths". In this blog we explain why Star Schemas are great for fast-to-deliver, potentially shorter lifetime projects, and how they enable you to unlock significant benefits when used as the foundation for Power BI data models in Microsoft Fabric.
Ralph Kimball released his first book on this subject in 1996. "The Data Warehouse Toolkit" became the "go to" reference book for thousands of data professionals around the world. They applied his principles of Dimensional Modelling and Star Schemas to design data warehouses and deliver powerful business intelligence solutions.
What has changed since Kimball introduced these principles in 1996?
Since these principles were established at the end of the last century, there have been significant advances in the technology platforms and the methods we use to deliver data and analytics solutions.
Over this time, the way in which Kimball principles are applied has also evolved:
Late 90's / Early 2000s - we tended to design "big up front monolithic enterprise-wide Star Schemas". These were large complex data models, designed to meet a broad set of reporting needs for the entire organisation. Project budgets were measured in units of millions and timescales in units of years. Looking at the socio-technical aspects, these models tended to be owned by a central team, who were often guarded and resistant to change. I designed my first enterprise scale data warehouse back in 2005, applying "Kimball principles" and it worked really well. It took 6 months of intensive data architecture work to reach consensus on the target schema and over 12 months to develop, test and roll out the solution. By taking this "one model to rule them all" approach, we had to make some compromises. For example, we decided not to handle the extra hour / missing hour on daylight saving long and short days respectively. This later impeded some of the analysis that users wanted to perform.
Today - we now design and implement "small domain orientated Star Schemas" that target a specific actionable insight. We avoid "Big Up Front Design", large capital investments and the notion of a delivering a single large data warehouse that is "cast in stone". Instead, we adopt agile principles, embrace new socio-technical models and leverage modern cloud native data platforms such as Microsoft Fabric to iterate faster, focusing on generating value in a smaller domain closer to the end user need. The result is that the star schema is simple and no comprises need be made because we are designing each star schema to address one narrow use case. This approach allows us to deliver value in a few weeks rather than many months.

In summary:
Kimball's (Star Schema) principles haven't changed it's just we now apply them at a smaller scale, faster cadence and closer to the end user need.
I will now explore why Kimball's design principles are as important today as they were almost 30 years ago and how they are applied in modern cloud native data platforms such as Microsoft Fabric.
Why are Star Schemas important?
When this modern approach to applying Star Schemas is used as the basis for reporting and analytics in Power BI, we consistently see the following benefits:
- Reports are business orientated and focused on targeting a specific actionable insight.
- Users find reports intuitive to use.
- Reports are interactive and support compelling data stories.
- Data models, measures, visuals and dashboards are easy to build and evolve.
- Implementation is smoother because Power BI is designed to work with Star Schemas, so you are not fighting against the tool.
- The schema is optimised for analytics, empowering the report builder to extract insights via DAX.
In a nutshell, if you not applying Star Schema principles to your reports, you should be seeking to do so.
There may be cases where a Star Schema is not the optimal for a specific report. But that would be the exception to the rule.
So what is a Star Schema?
Star Schemas are the output of a practice known as Dimensional Modelling. The objective is to design data models that are optimised for reporting and analysis.
It's not as scary as it sounds! Dimensional modelling seeks to model the business domain and capture semantics to structure the data in way that reflects the real world.
A good test for any Star Schema is that it should be straightforward to explain to end users, because it reflects their mental model of the domain, using terminology they use in their everyday work.
A Star Schema (like any schema for tabular data) is composed of tables, which are composed of columns. Relationships exist between the tables.
In a Star Schema there are two types of table:
| Dimension Tables | Fact Tables |
|---|---|
| Describe business entities | Store observations or events |
| Often contain categorical data | Often contain numerical data |
| Usually slow to change | Will change and grow over time |
Note - dimension tables are typically slow to change because they can often be populated up front. For example, in the worked example below, the Country dimension table can be pre-populated with all World countries and the Year dimension can be pre-populated with data for the next 100 years.
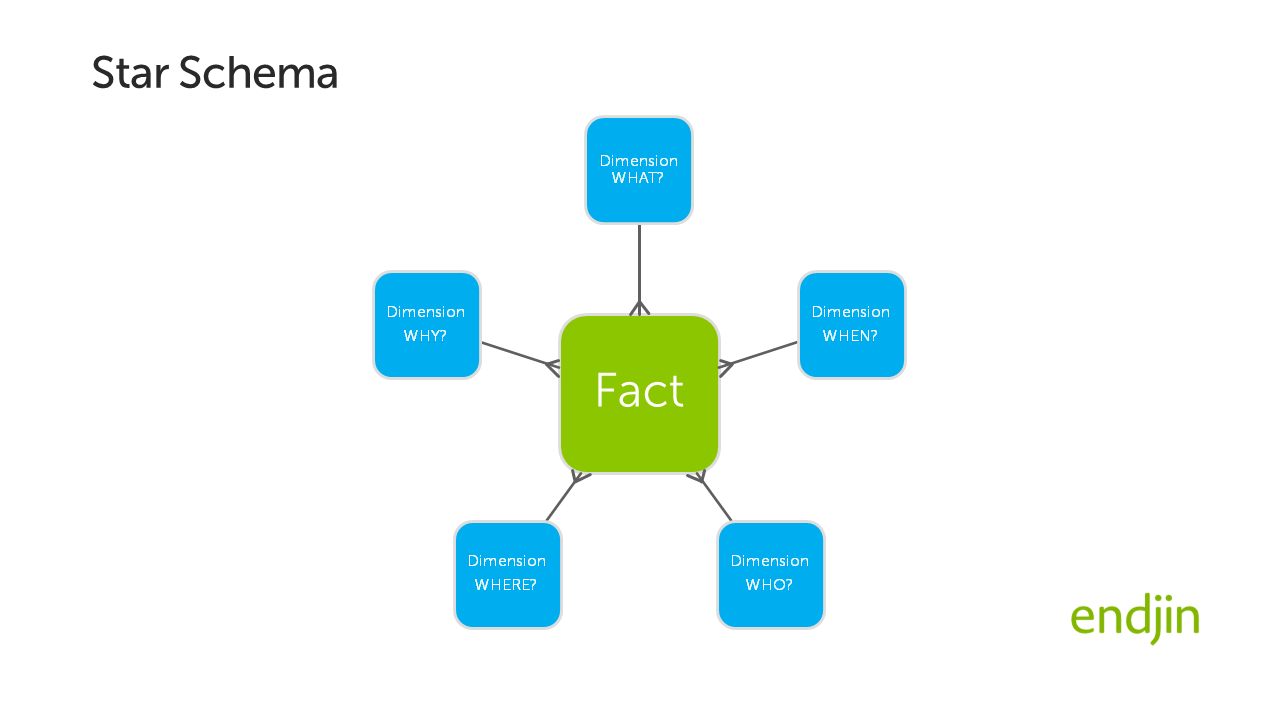
Dimension tables capture key attributes of a record in the fact table - allowing you to answer questions such as:
- When? exploring points in time, or grouping data over time periods such as days, months, years.
- Who? by representing organisations, departments or even individual people.
- What? identifying specific products or services.
- Where? understanding relationships to physical and virtual locations.
Fact tables store the numerical data / transactions that you want to aggregate, group, filter, slice and dice (using the dimensions above) to deliver a specific actionable insight.
The simplest Star Schema has one fact table and a small number of dimension tables. Each of the dimension tables has a "one to many" relationship with the fact table. When arranged on an entity relationship diagram, this leads to a star-like arrangement, hence the name Star Schema! This is illustrated below:
Power BI and Star Schemas?
Power BI is optimised to work with Star Schemas. There are many articles that describe the technical benefits. A few worth highlighting are Microsoft's own guidance regarding the importance of Star Schemas for Power BI and a technical deep dive from Alberto Ferrari of SQL BI that concludes:
A star schema is always the best choice.
What it boils down to is:
- Lower total cost of ownership - in three ways:
- Data models that are simple. They have a smaller number of tables and relationships. Therefore, they are easier to understand and evolve.
- Memory requirements are minimised - the data structures in a star schema are well suited to the column-store approach used by the VertiPaq engine at the heart of Power BI. This means that is able to compress the data minimising the memory footprint.
- Compute requirements are minimised - a star schema is optimised for analytical workloads, queries over the data involve very few joins across tables, therefore the amount of compute required to return analytics is reduced.
- Better user experience - better performance when querying and interacting with the data.
- Maximising value from data - by unlocking all of the features in Power BI such as DAX measures or interactive features in visuals.
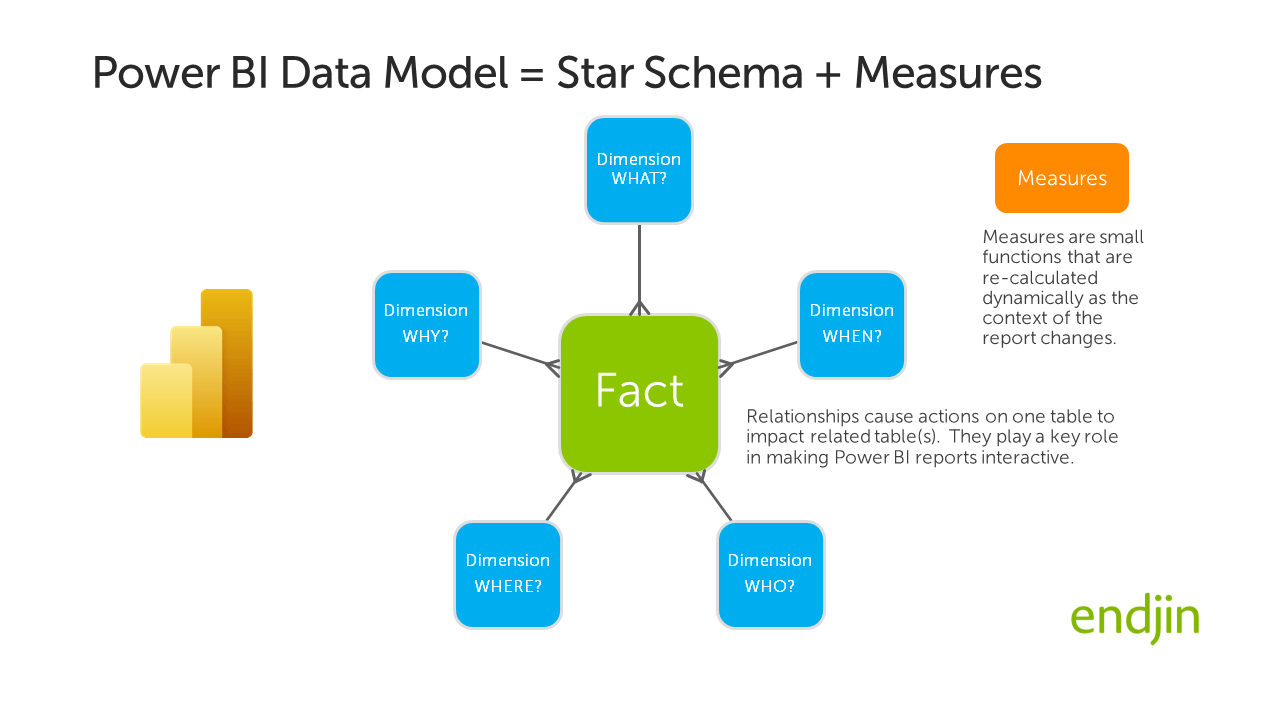
The data model that underpins every Power BI report implements the Star Schema as tables and relationships. DAX based measures are then layered on top of this data model to generate the analytics that are surfaced in the report.
This concept is illustrated below:
Worked example: World Health and Wealth report
To bring this more to life, the following screen shot shows how we have put Star Schema principles into practice in our World Health and Wealth report which is available to view on the Power BI Gallery.
Fact tables
In the report there are two fact tables:
- Wealth - GDP metrics
- Health - life expectancy metrics
These are both sourced from the World Bank Open Data website. They are both time series datasets, with data available for a range of countries over a number of years.
Example contents from these tables is provided below.
Wealth fact table
There are two different wealth metrics that we want to analyse: "GDP (current US$)" and the same metric but normalised based on population "GDP per capita (current US$)". Here is an sample of data covering 5 years of data for two countries:
| Country Code | Year | GDP (current US$) | GDP per capita (current US$) |
|---|---|---|---|
| GBR | 1972 | $169,965,034,965 | $3,030 |
| GBR | 1971 | $148,113,896,325 | $2,650 |
| GBR | 1970 | $130,671,946,244 | $2,348 |
| GBR | 1969 | $116,464,702,803 | $2,101 |
| GBR | 1968 | $107,759,910,068 | $1,952 |
| AUS | 1972 | $52,051,401,869 | $3,950 |
| AUS | 1971 | $45,222,309,329 | $3,496 |
| AUS | 1970 | $41,337,215,814 | $3,305 |
| AUS | 1969 | $36,686,079,068 | $2,992 |
| AUS | 1968 | $32,716,989,584 | $2,724 |
Health fact table
For health we are using "Life expectancy at birth" for females, males and combined. Here is an sample of data covering the same two countries and 5 year period:
| Country Code | Year | "Life expectancy (female)" | "Life expectancy (male)" | "Life expectancy (all)" |
|---|---|---|---|---|
| AUS | 1968 | 74.32 | 67.68 | 70.91 |
| AUS | 1969 | 74.38 | 67.72 | 70.96 |
| AUS | 1970 | 74.44 | 67.76 | 71.01 |
| AUS | 1971 | 74.5 | 67.8 | 71.06 |
| AUS | 1972 | 74.92 | 68.16 | 71.45 |
| GBR | 1968 | 74.9 | 68.7 | 71.72 |
| GBR | 1969 | 75 | 68.6 | 71.72 |
| GBR | 1970 | 75.2 | 68.9 | 71.97 |
| GBR | 1971 | 75.5 | 69.2 | 72.27 |
| GBR | 1972 | 75.3 | 69.1 | 72.12 |
Dimension tables
The two fact tables above share two dimension tables:
- Year - which is the "When?" dimension
- Country - which is the "Where?" dimension
Year dimension
The Year dimension is very simple, but it allows additional information in the form of Decade (an integer) and "Decade Name" (a string) which allows us to group and summarise the year dimension in the report:
| Year | Decade | Decade Name |
|---|---|---|
| 1968 | 1960 | 1960s |
| 1969 | 1960 | 1960s |
| 1970 | 1970 | 1970s |
| 1971 | 1970 | 1970s |
| 1972 | 1970 | 1970s |
Country dimension
The Country dimension holds some top level information about the Country, but also provides information such as "Income Group" and "Region" which enables us to filter, group and summarise the country dimension in the report:
| Code | Short Name | Long Name | Income Group | Region | Currency Unit | Latest population census | WB-2 code |
|---|---|---|---|---|---|---|---|
| AUS | Australia | Commonwealth of Australia | High income | East Asia & Pacific | Australian dollar | 2016 | AU |
| CHN | China | People's Republic of China | Upper middle income | East Asia & Pacific | Chinese yuan | 2020 | CN |
| CRI | Costa Rica | Republic of Costa Rica | Upper middle income | Latin America & Caribbean | Costa Rican colon | 2011 | CR |
| GBR | United Kingdom | United Kingdom of Great Britain and Northern Ireland | High income | Europe & Central Asia | Pound sterling | 2011 | GB |
| USA | United States | United States of America | High income | North America | U.S. dollar | 2020 | US |
| TZA | Tanzania | United Republic of Tanzania | Lower middle income | Sub-Saharan Africa | Tanzanian shilling | 2012 | TZ |
Star schema in action
Because we have implemented shared (or "conformed") dimensions (year, country) across both fact tables, it is simpler and more intuitive to create analytics and visualisations over the data. For example, the animated scatter chart below relies on an independent time dimension table to be in place for the animation to work. This is a great example of how the star schema works as the "unsung hero" behind the scenes allowing us to deliver engaging visualisations such as the Hans Rosling inspired animated scatter chart through a few simple steps in the Power BI report designer:
Star Schema in Microsoft Fabric?
Star Schemas are entirely consistent with Microsoft Fabric and modern lakehouse architectures. Indeed, the Star Schema should be considered a key artefact in your Microsoft Fabric architecture.
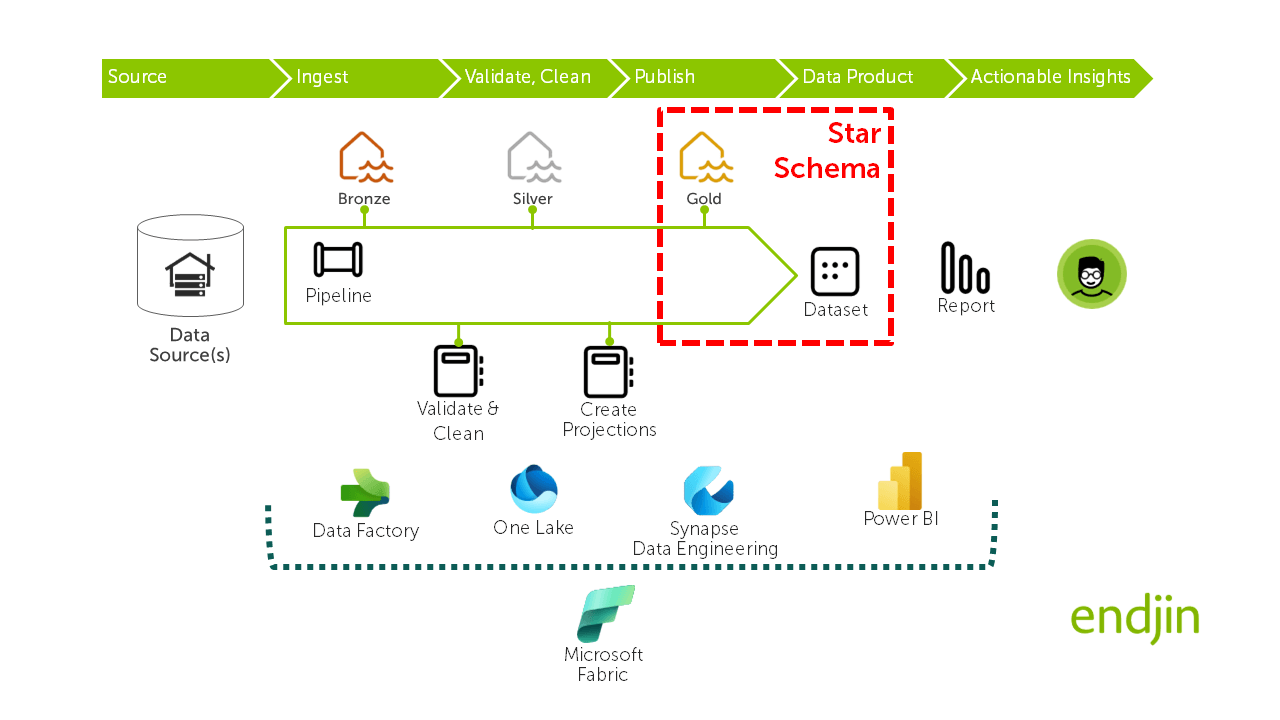
The diagram below illustrates how the Star Schema is typically implemented across two layers in Fabric:
- The data is materialised as discrete tables in the Gold layer of the lake house - typically as Parquet files in OneLake (often adopting Delta format), with schema definitions in the Hive metastore. This enables these tables to be addressed logically by name in the Power BI dataset.
- The Power BI dataset is then constructed over these tables by layering the relationships, semantics and measures over the tables - creating what we refer ro as the semantic model.
Power BI reports are then delivered on top of the dataset to deliver actionable insights to end users.
Microsoft Fabric emphasizes this architecture by automatically creating default datasets and enabling new datasets to be constructed directly in the Fabric web portal and through a new technology called direct lake Power BI is able to connect directly to lakehouse tables. This new ground breaking approach to connecting Power BI to lakehouse tables offers the "best of both worlds" over the existing methods of direct query (which can be slow) and import (which creates a disconnected copy of the data in the Power BI dataset). This is possible due to the similarities between the VertiPaq engine in Power BI and the Parquet file format in the lake, both of which use columnar format - Sandeep Pawar provides a deeper insight into this in Power BI Direct Lake Mode : Frequently Asked Questions.
At what stage in the software design lifecycle should the Star Schema be designed?
The Star Schema should be identified as early as possible in the lifecycle. We recommend taking a goal driven approach to scope each Star Schema around a single actionable insight - remember we want to avoid falling into the trap of designing a "big up front monolithic enterprise-wide star schema" and instead focus on designing and implementing "small domain orientated Star Schemas"!
With this Star Schema design in place, we can use this in a similar manner to an API contract to decouple:
- Upstream processes to design the data lake and the implement data wrangling pipelines that will generate the tables in the star schema
- Downstream processes to build the Power BI data model over the star schema (relationships, semantics, measures) and then creating the Power BI report (pages, visuals, dashboards)
By having the semantic model in place early in the lifecycle, we are able to inject realistic synthetic test data into the star schema (a task that OpenAI / GPT / LLMs can be harnessed to perform) and use this to fast track creation of the report. This approach means the report building phase is not dependent on the data engineering being completed, allowing the report and data pipelines to be developed in parallel, accelerating time to value.
Does a Star Schema only apply where data is being visualised in Power BI?
Traditionally, Star Schemas are most suited to solutions that require:
- Interactive visualisation of analytics using tools such as Power BI
- Query languages such as DAX over analytical data.
If you are working with data in a notebook to perform data exploration or develop a machine learning model, then traditionally you would tend work with data that is fully de-normalised in a single dataframe.
But that approach is being challenged, Fabric has introduced semantic link, enabled by a Python package, which allows you to interact directly with a Power BI data model from a Fabric notebook. One objective of this is to enable data scientists to work with data in a Power BI data model, rather than having to maintain a separate dataframe.
We have been evaluating semantic-link and are very excited about the potential it offers. We will be publishing a blog on this subject shortly.
Is Star Schema compatible with Data Mesh?
Absolutely! We believe that a Star Schema is entirely consistent with Data Mesh principles. We view the Star Schema as the foundation for a specific type of data product, that is optimised for reporting and analytics and is designed to be consumed by Power BI reports, DAX based analytics and emerging use cases enabled by semantic link.
In our opinion, the Power BI data model is the "data product". It encapsulates the data (as tables), relationships between tables, semantics and measures. It provides an industry standard means of interacting with the data via different tools. It enables layers of governance to be put in place to manage access to data and to manage the ongoing evolution of the data model. It can be published to a centralised location and promoted so that it can be discovered and consumed by other users.
Are there alternatives to a Star Schema?
This blog sings the praises of the star schema, but what are the alternative approaches?
The visual below sets out the spectrum of choices that are available from "single table" on the left, all the way to a fully normalised schema on the right.
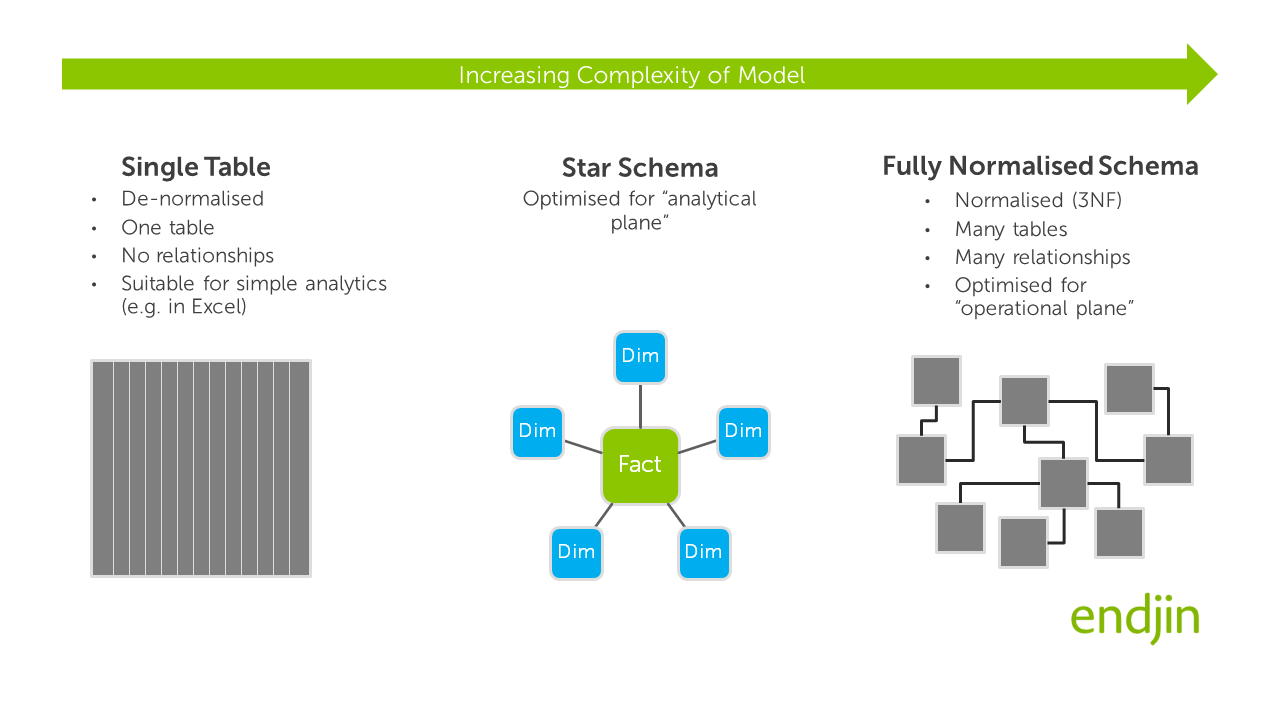
As you can see from the illustration above, the star schema sits between these two extremes:
- It is slightly more complex that the single table approach, but offers all of the benefits that we have described above.
- It is significantly simpler than schemas that tend to be developed for systems in the "operational plane" where a design philosophy called the third normal form (3NF) is applied which aims to eliminate data duplication in the model. The underlying process of "normalisation" leads to proliferation of tables and relationships in the model. If this 3NF approach was to be applied for data models in Power BI, DAX code would more difficult to write, understand and maintain because complex sets of joins would be required over the data to generate useful analytics. It would also tend to result in poorer performing queries and a user experience that is less intuitive when interacting with the report. By adopting a star schema you're trading possible data duplication for ease of querying.
Whilst it is absolutely feasible to build Power BI reports that are based on these other approaches, in general we would not recommend it.
What's not to like?
We hope we have convinced you to adopt Star Schemas as part of your modern data platform architecture. We have focused on how this could be leveraged in Microsoft Fabric architecture but it is just as relevant to Azure Synapse Analytics, Databricks or Snowflake.
There are a vast array of resources out there to help you get started. Not least Kimball's own reference book on the subject.
It's a skill that is best developed through doing. We recommend prototyping your data model designs - for example by mocking up data in Excel and loading that into a Power BI data model. Use this to explore how the model supports the actionable insights you are seeking to deliver and iterate accordingly.
When you get it right you will know it!
- Your data model will look simple and will be easy to explain.
- Your report will be easy to build and maintain.
- DAX measures will be straightforward to implement.
- You will be able to unlock all of the features in Power BI.
- End users will find reports intuitive and interactive.
- The Star Schema will provide a "pivotal" artefact in your Microsoft Fabric architecture, enabling you to decouple upstream and downstream processes.
- It will enable you to apply Data Mesh principles.
- By thinking of Fabric datasets as the "data product" layer, you are in a position to embrace new technologies such as semantic-link.