Dynamically switch Power BI measures with Field Parameters


In the Power BI May 2022 Feature Summary, a new preview feature called Field Parameters has been released. Field Parameters allow you to dynamically change the measure being analysed within a report. This feature helps end-users to easily explore different metrics in a visual by selecting the measure they're interested in within a slicer.
What is exciting about this new feature is how easy it is to setup. With no advanced modeling required, you can now easily create advanced visuals with dynamic axis and metric selections without the need for work-arounds used prior to the release of this feature, which were more complex and took longer to setup.
This blog post will explore how to use the new Field Parameters feature to dynamically switch between measures in a visual, as well explaining a previous work-around to achieve the same functionality.
How to dynamically switch between measures using Field Parameters
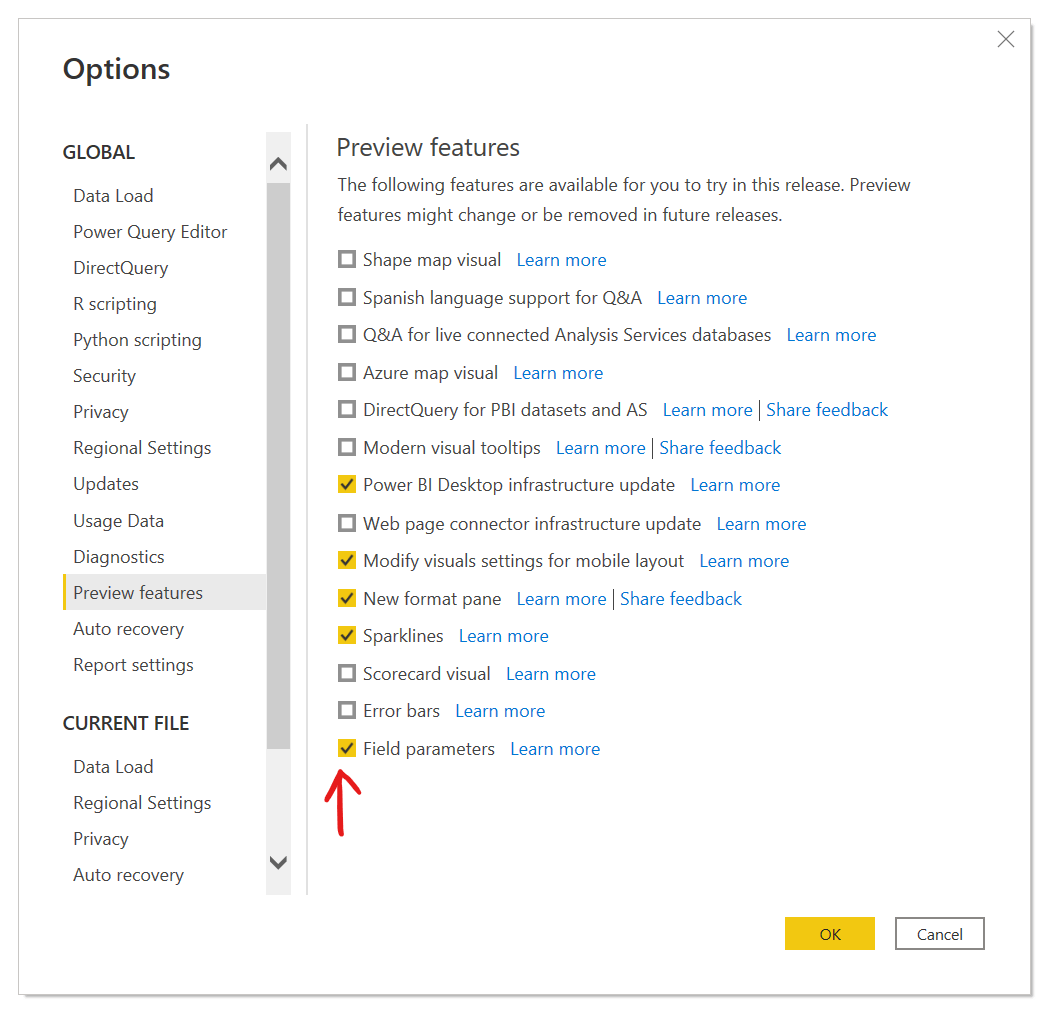
1. Ensure that Field Parameters is turned on in Preview Features
Firstly, navigate to Options and Settings > Options > Preview Features, and ensure that Field Parameters is enabled. Next, restart Power BI Desktop to begin using the Field Parameters feature.
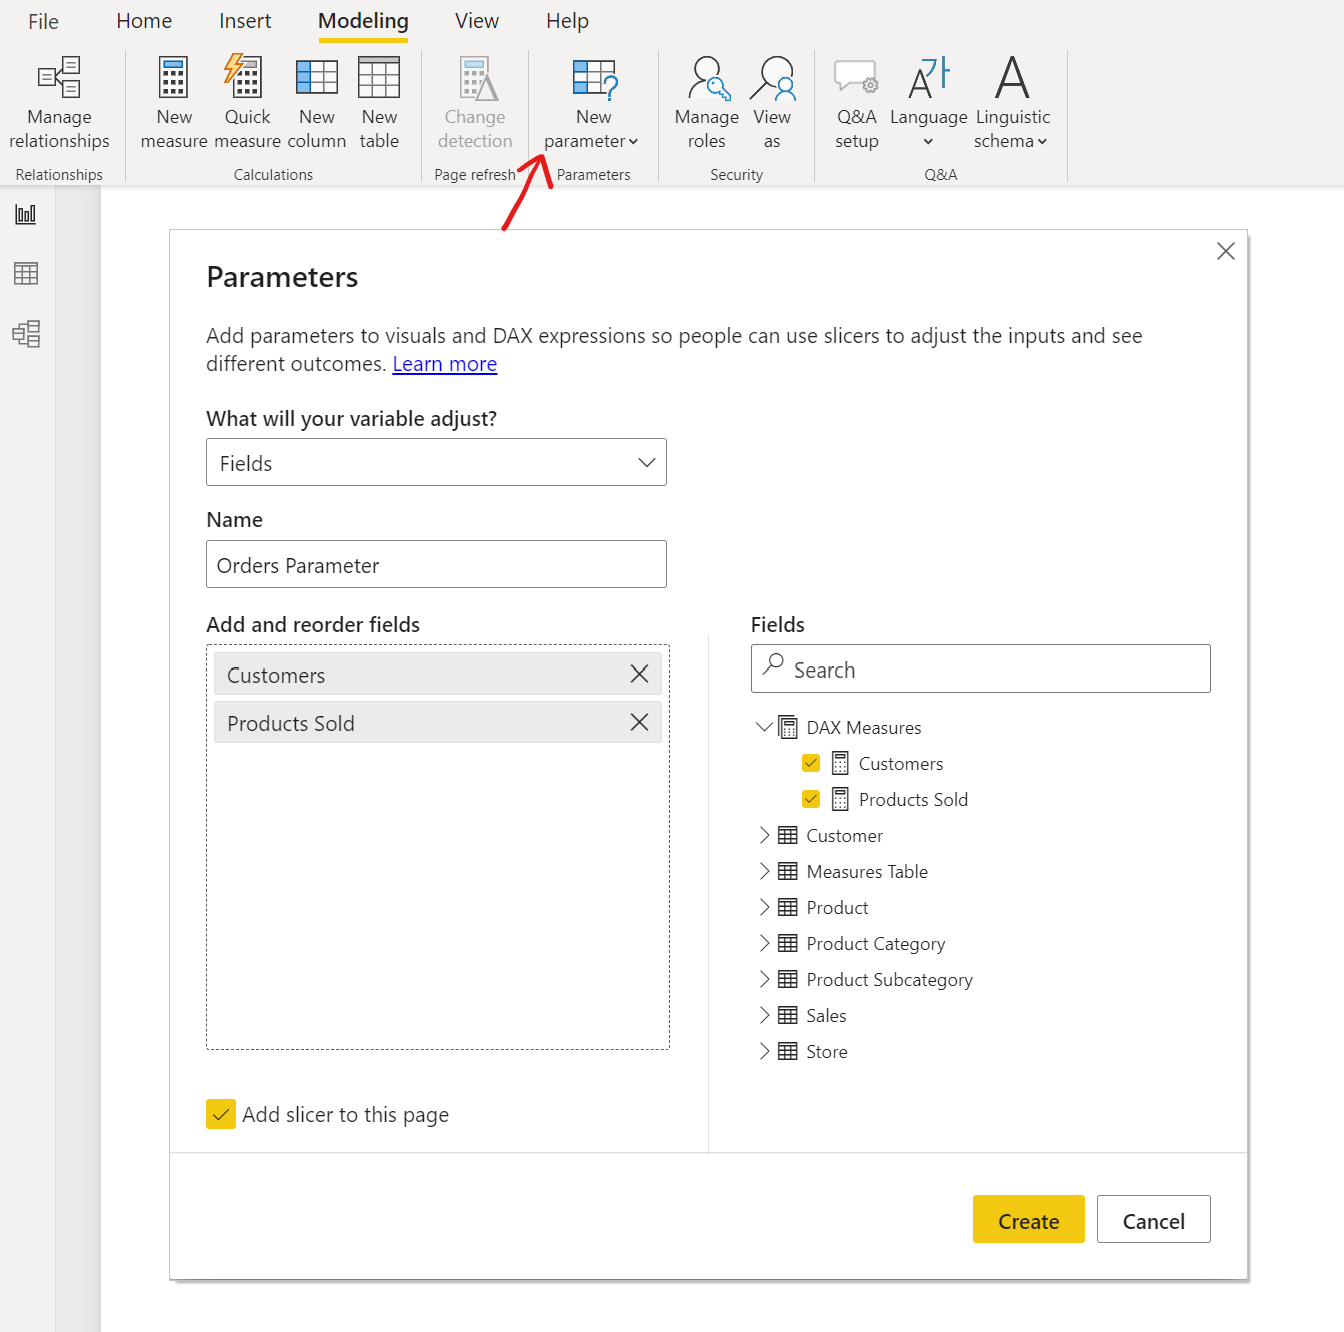
2. Set up Field Parameters
To get started with Field Parameters, go to the Modeling tab in the ribbon and there is an option 'New Parameter', select 'Fields' from here to open the Parameters pop-up. Then, you need to provide the name of your first parameter. In this example I will be calling our parameter 'Orders Parameter'.

Then select the fields from the Fields section you would like to include as your field parameters. In this example, I will be using the 'Customers' and 'Products Sold' measures.
Ensure that you select 'Add a slicer to this page' and press 'Create'. This will automatically add the slicer to your page.
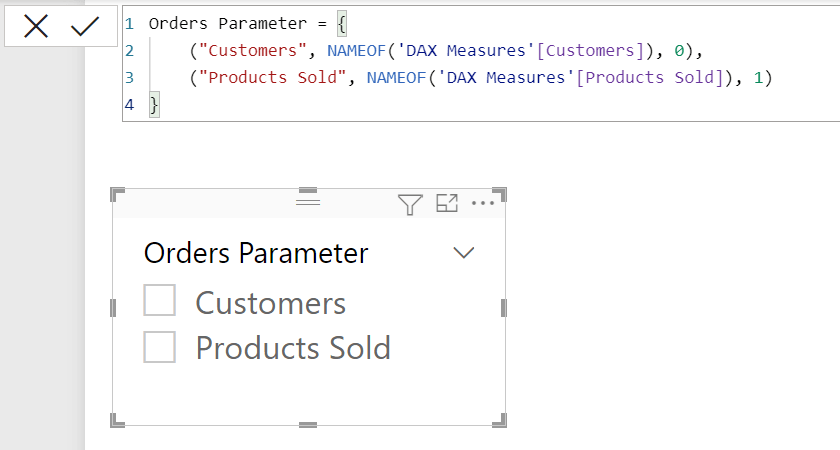
You can see Power BI has created a new calculated table called 'Order Parameter' which has a formula. This formula shows the display names of your slicer values, there is a NAMEOF function which is connected to your actual Field and the numbers at the end of each line of the formula represent the sequence in which your slicer values appear in the slicer selection. You can easily change the order of your slicer values by changing these numbers. You can also easily change the display name of your slicer values by changing the text within the quotation marks at the start of each line of the formula.
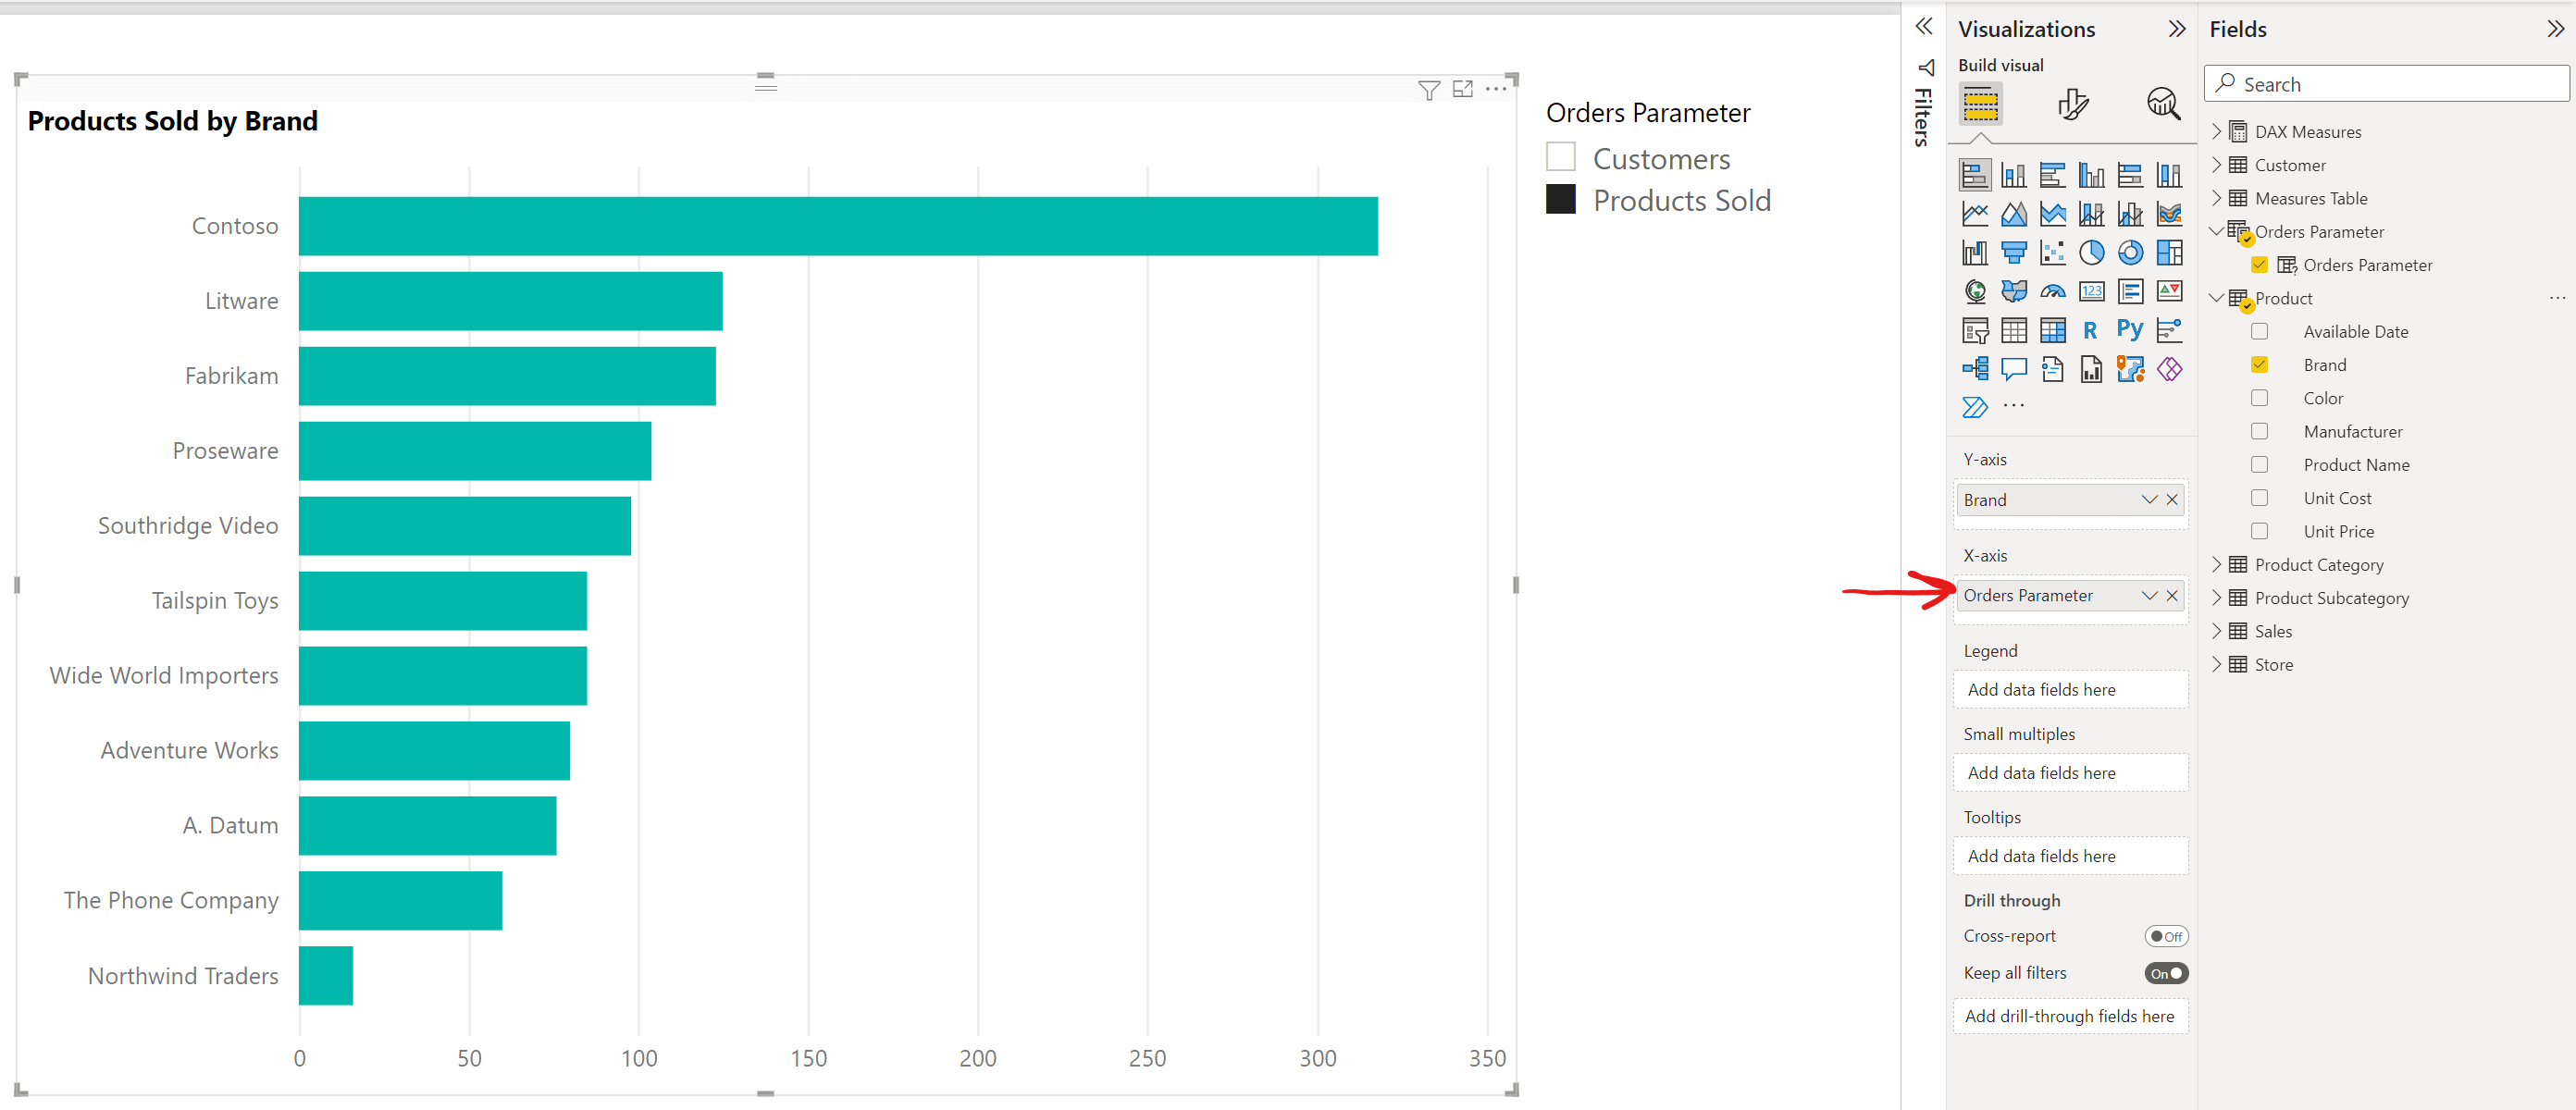
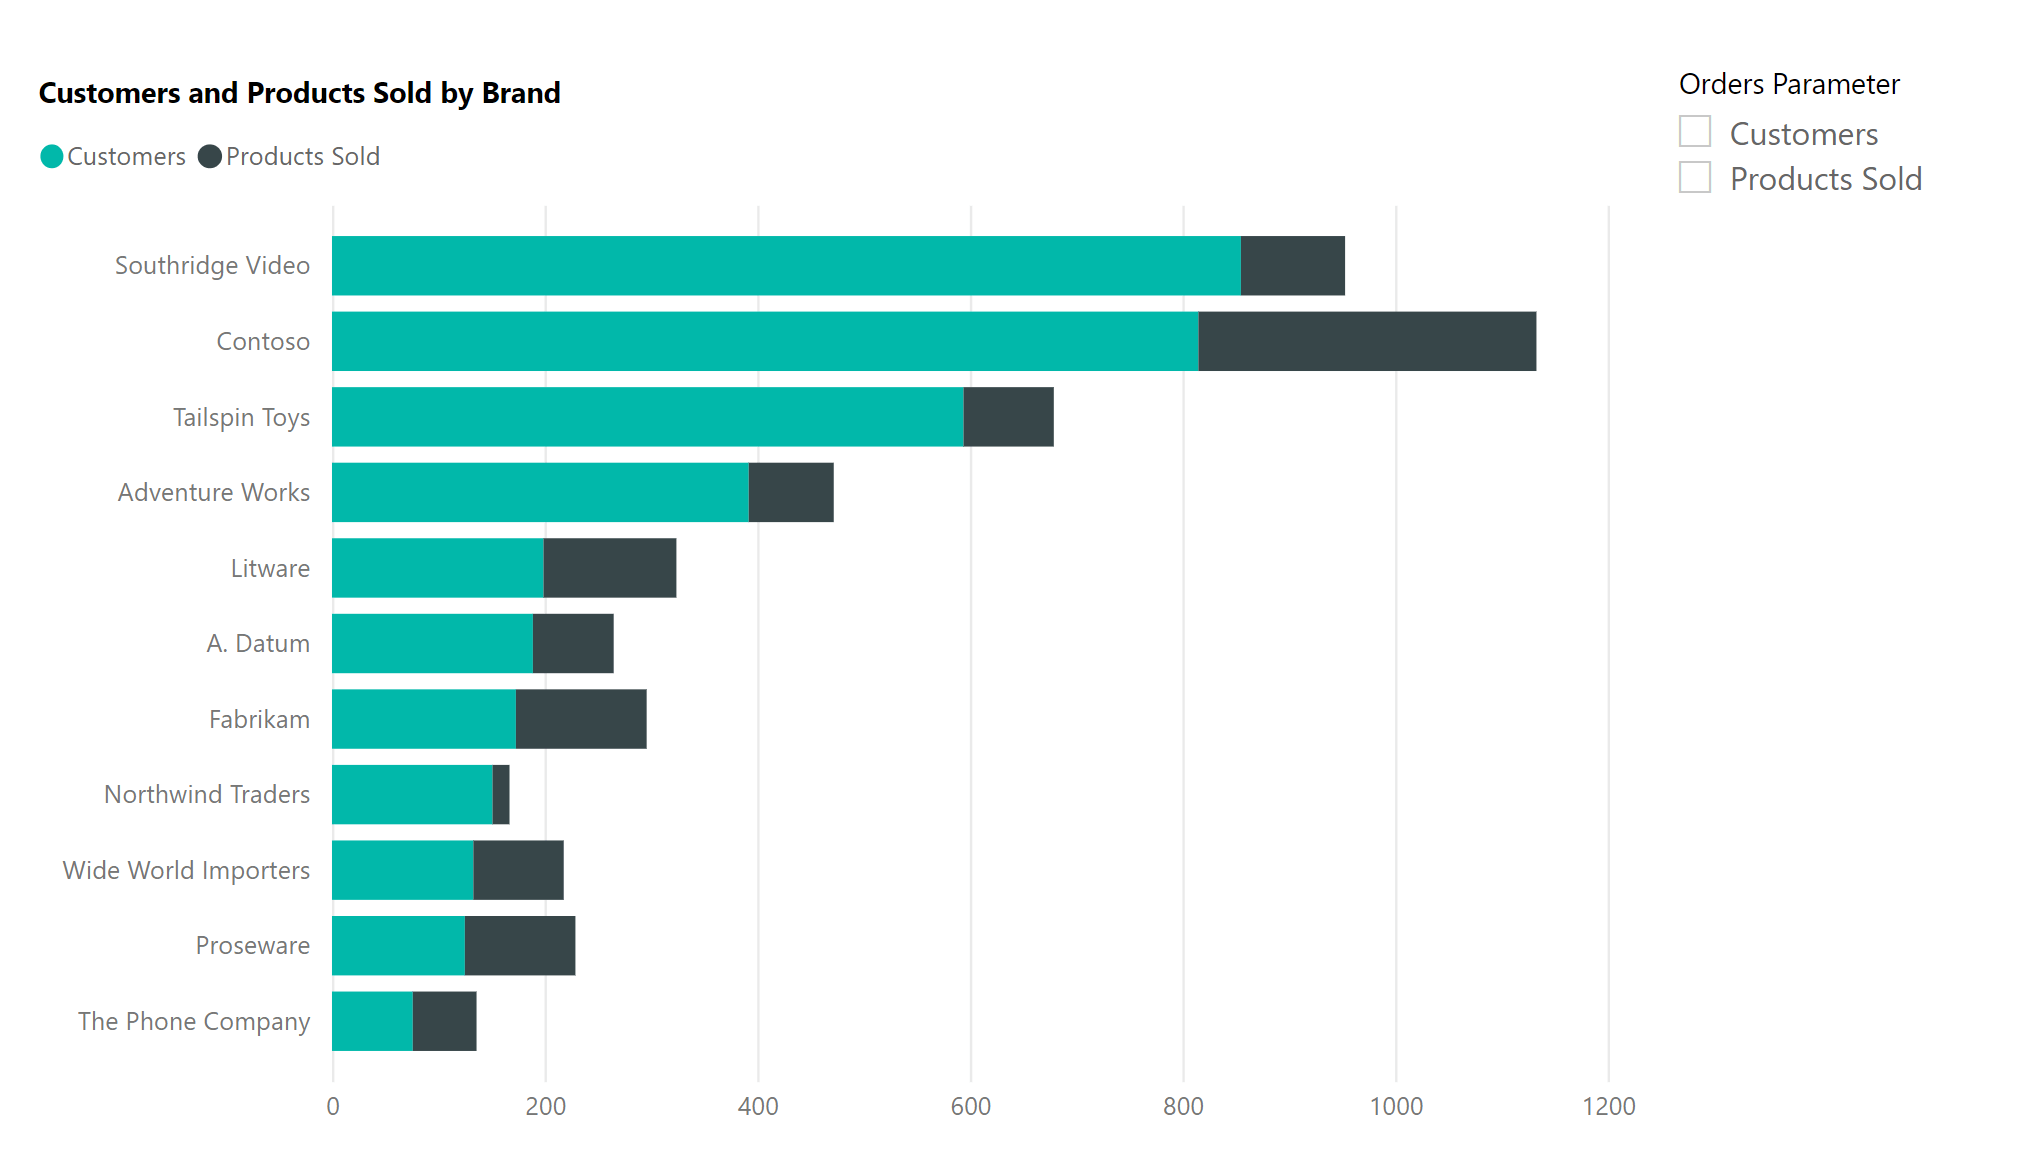
3. Add your visual
You can add your Field Parameters to any visual. If we create a stacked bar chart with 'Brand' as the Y-axis value and then and add our new 'Orders Parameter' as the X-axis value, the user can now interact with the slicer to toggle between the 'Customers' and 'Products Sold' measures. The chart displays either the number of products sold by brand, or, the number of customers by brand.

Limitations of the Field Parameters feature
There are a few limitations of the new Field Parameters feature. Firstly, Q&A and AI visuals are not currently supported with Field Parameters. The Field Parameters feature is not supported for implicit measures i.e. the default summarisation of the columns. Finally, with Field Parameters, you cannot set a default option in the event that a single field has not been selected within the slicer. If no field has been selected in the slicer, by default, the visual shows the values for all fields. This final limitation can be partially mitigated by navigating to slicer settings within the 'Visualizations' pane and enforcing single-select on the slicer.
How to dynamically switch between measures using a work-around
Prior to Field Parameters, the following work-around could be used to achieve the same functionality. You may still want to use this work-around to overcome some of the limitations of the new Field Parameters feature. For example, if you would like to set a default option in the event that a single measure has not been selected within the slicer, you can do this with this work-around. This functionality is not currently available with Field Parameters.
So, what are the steps?
1. Create a measure name table to use in a slicer
Firstly, create a new single-column table which defines the measure names. You can do this manually using 'Enter Data'.
In this example, I will be switching between two measures: 'Products Sold' and number of 'Customers'.

In your dashboard, create a slicer and use the measure names column as your slicer selection.

2. Create a DAX expression to switch between the measures
Next, create a new DAX expression to switch between the measures:
Selected Measure =
IF (
    HASONEVALUE ( 'Measures Table'[Measure] ),
    SWITCH (
        VALUES ( 'Measures Table'[Measure] ),
        "Products Sold", DISTINCTCOUNT ( Sales[ProductKey] ),
        "Customers", DISTINCTCOUNT ( Sales[CustomerKey] )
    ),
    DISTINCTCOUNT ( Sales[ProductKey] )
)
Here, the expression looks at what value has been selected in the measure names table with the slicer. Dependent on the selection, a different calculation is returned. For example, if 'Products Sold' is selected, then a DISTINCTCOUNT of the number of products sold will be returned. Whereas, if 'Customers' is selected, then a DISTINCTCOUNT of the number of customers will be returned.

The expression needs a default option in the event that a single measure name has not been selected. In this example, we are using a DISTINCTCOUNT of the products sold as the default.
Finally, you should add the new 'Selected Measure' DAX expression to the value field of the chart.
3. Create a dynamic title
You can also create a dynamic title for the chart so that it is clear what is being displayed. The DAX expression for this could be:
Measure Title =
IF(
    HASONEVALUE('Measures Table'[Measure]),
    VALUES('Measures Table'[Measure]),
    "Products Sold"
)
& " by Brand"
It is important to ensure that the default title matches the default measure used in your chart.
You can then add this dynamic title to the chart using conditional formatting.

And here is the final result!
The user can interact with the slicer to toggle between the two measures. The chart displays either the number of products sold by brand, or, the number of customers by brand.


Field Parameters vs. work-around
| Feature | Field Parameters | Work-around |
|---|---|---|
| Set up | You need to enable Field Parameters in Power BI Desktop > Options and Settings > Options > Preview Features. Then restart Power BI Desktop. Field Parameters are easy to configure using the Modeling ribbon in the Power BI Desktop interface. Display names and the order of Field Parameters in the slicer are easily adaptable by editing the DAX formula of the calculated table generated by Power BI upon creation of Field Parameters. |
Multiple steps required to manually add dynamic measures to your report. Including creating a measures table, manually writing a DAX calculation to switch measures and adding a slicer to your report. If want to edit the display names in the slicer, you need to edit the measures table directly. You must also ensure these display names are updated within the DAX calculation. You cannot change the order of the measures within the slicer. |
| Slicer selection options | You cannot set a default option in the event that a single field has not been selected within the slicer. This limitation can be partially mitigated by navigating to slicer settings within the 'Visualizations' pane and enforcing single-select on the slicer. You can do multi-select and show the values for all field parameters on the chart. |
You can set a default option in the event that a single field has not been selected within the slicer. You cannot do multi-select to show all measures within a chart simultaneously. |
| Support | Q&A and AI visuals are not currently supported with Field Parameters. Field Parameters are not currently supported for implicit measures. |
You can use the work-around for Q&A visuals. |
Conclusion
In this blog post we have seen how the new Field Parameters feature can be used to dynamically switch between measures in a visual. We have seen how easy Field Parameters are to setup, with no complex modeling required in order to create advanced visuals with dynamic axis and metric selections. Finally, we have seen how work-arounds can still be used to overcome some of the limitations of the new Field Paramaters feature.