Performance Optimisation Tools for Power BI


One of the best practices to follow while using Power BI is to undertake some performance tuning for your reports. This could be for a variety of reasons such as you encountered performance issues and want to identify the bottlenecks, or you simply want to follow best practices to ensure the performance of your report is as optimal as it can be.
It can be challenging to drill-down and identify the source of performance issues because multiple factors in combination can affect report performance. To help with identifying performance bottlenecks, there are a number of built-in and open-source tools you can utilise. These tools pinpoint potential performance issues you can then investigate to optimise your Power BI report. This blog post highlights three tools you can use to assess the performance of your Power BI reports.
VertiPaq Analyzer in DAX Studio
The first place to look when trying to troubleshoot performance issues is the data model. To investigate the data model, Vertipaq Analyzer in DAX Studio is a useful tool. Vertipaq Analyzer provides statistics for the tables, columns, queries and size of items within your Power BI Desktop file. These metrics give the user an overview of the data model and provide insights into where optimisation may be required.
Identifying and removing tables and columns which are not used within your Power BI report is the best way to optimise the data model and improve performance. There are three important statistics to look at in Vertipaq Analyzer to identify the unused tables and columns that are most significantly affecting performance.

Size
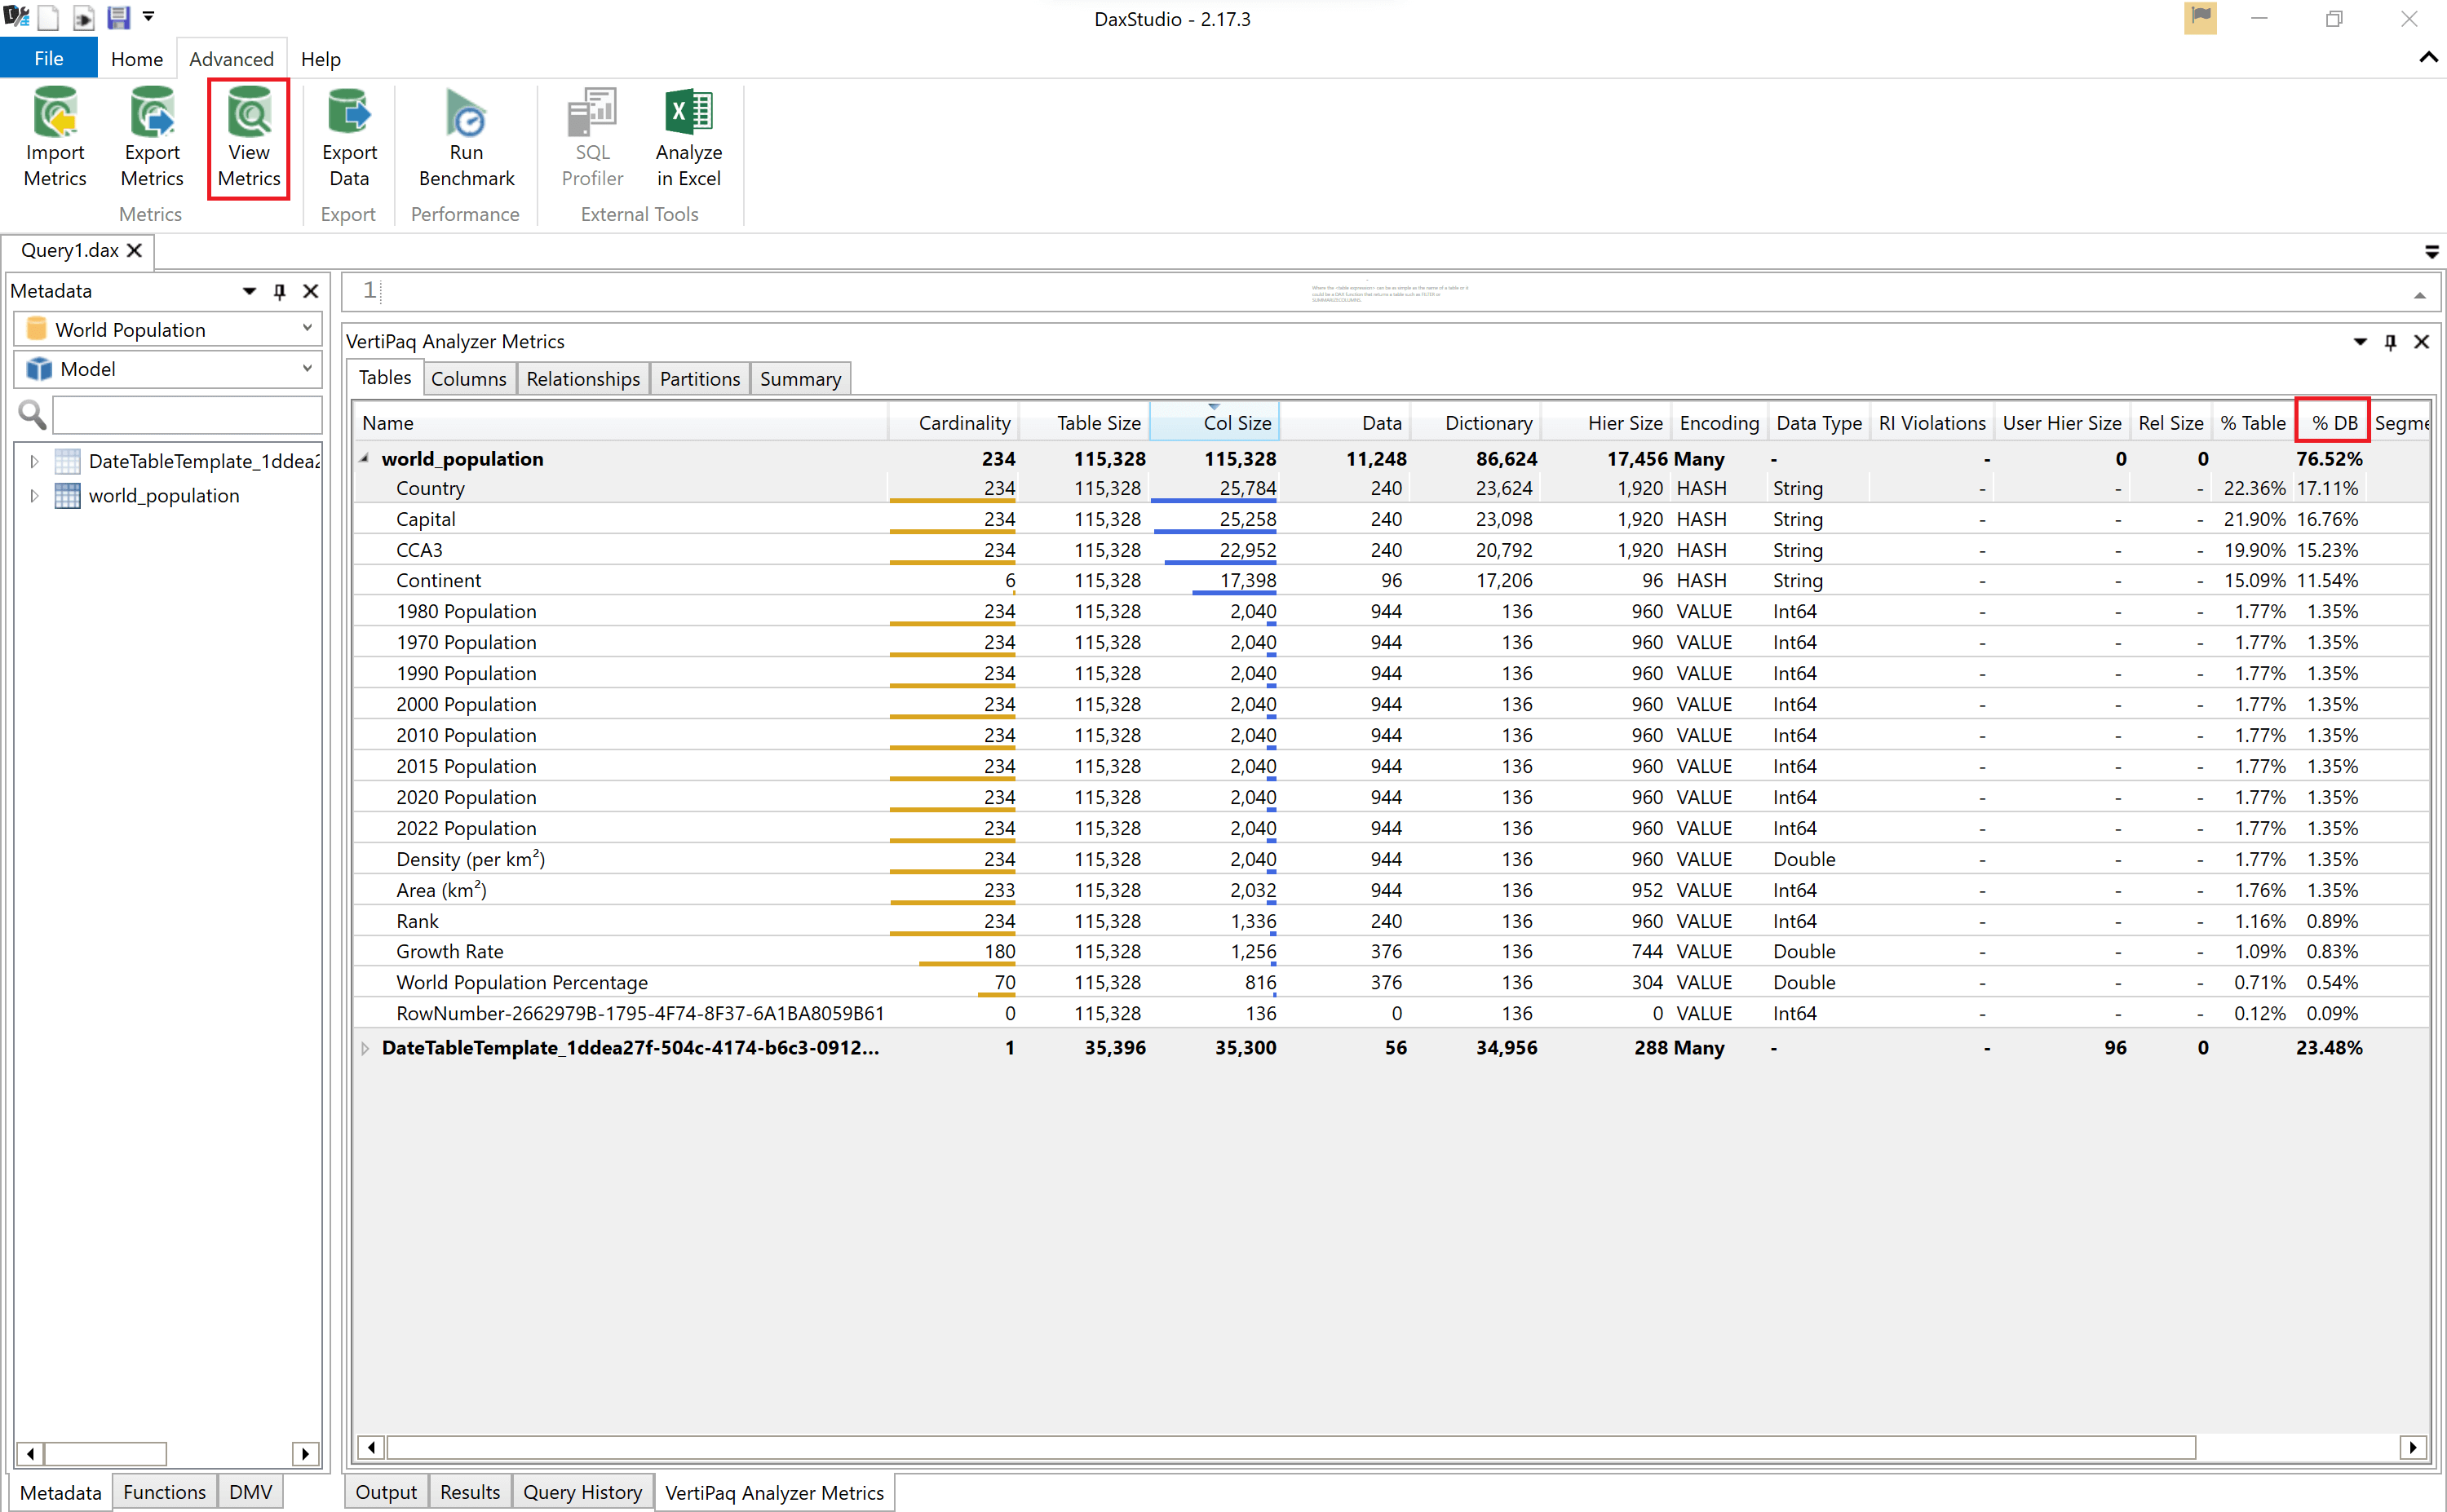
Analysing the size of the tables and columns within your Power BI report is an important step in optimising the data model and troubleshooting performance issues. By looking at the '% DB' column, we can see how much space each table/column is taking up of the entire model. Removing unused tables/columns with a high % DB value will free up space and improve performance.
Hierarchy
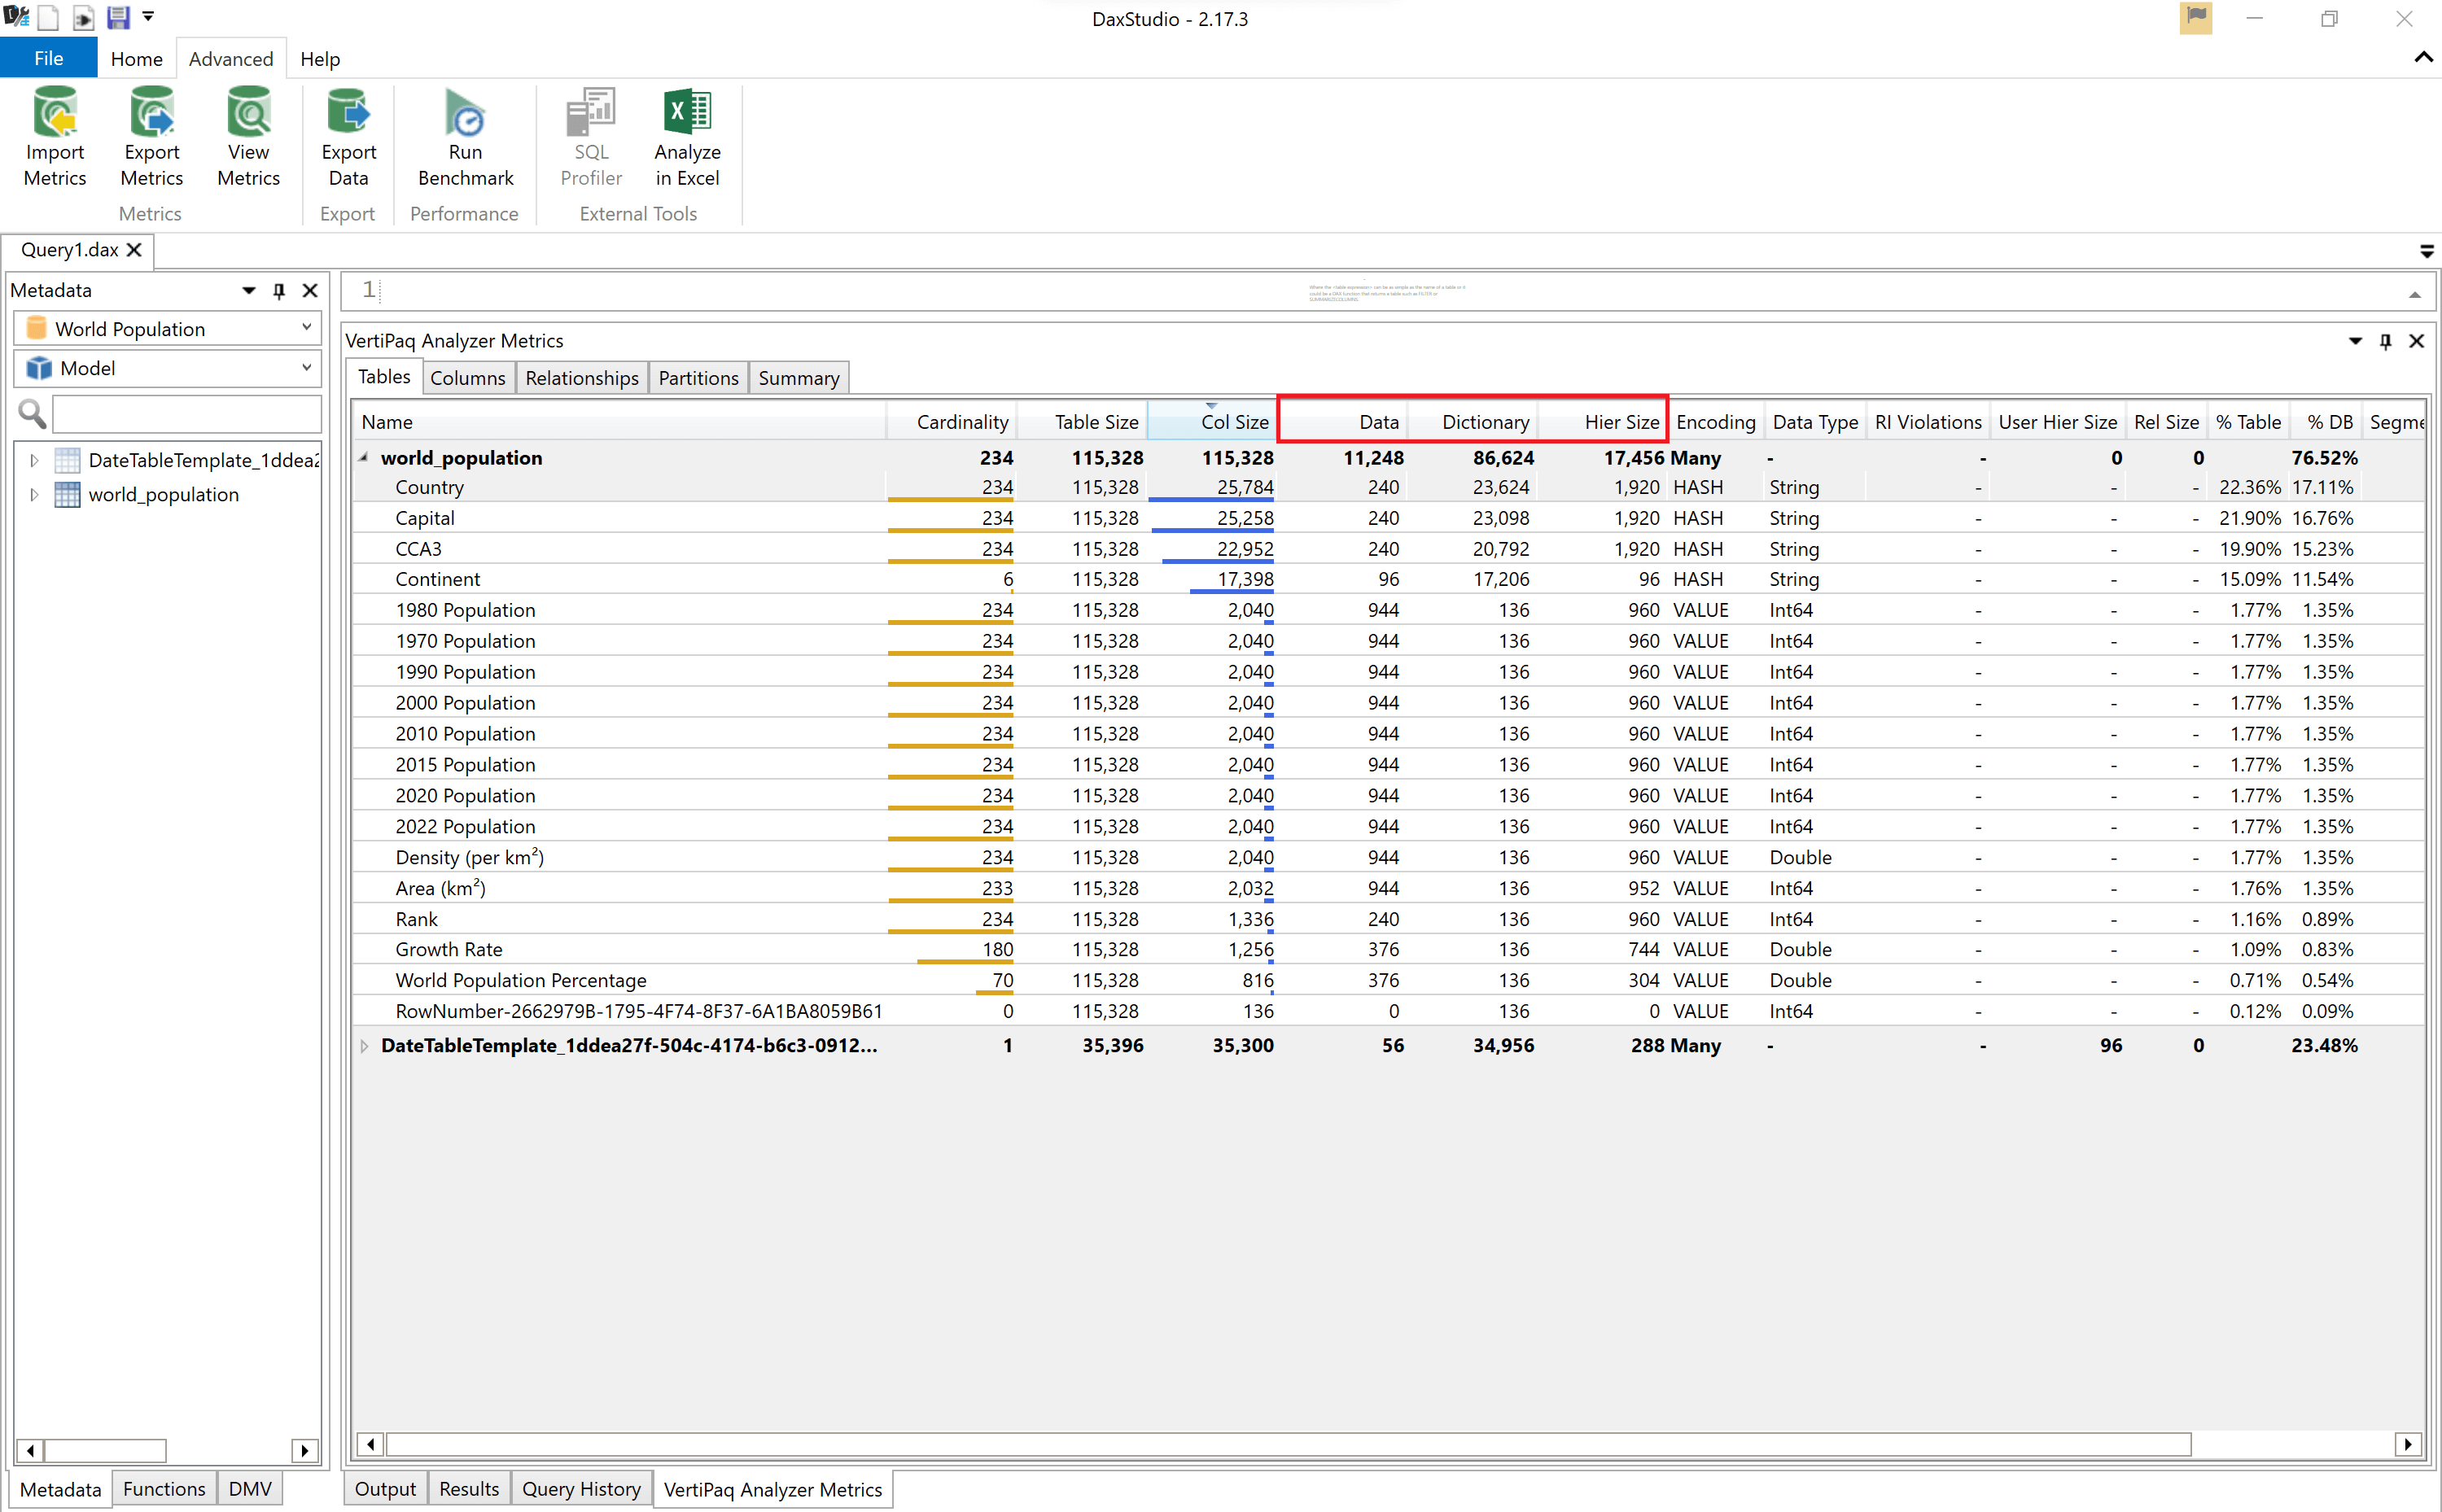
We can also see three columns: 'Data', 'Dictionary' and 'Hierarchy Size'. The sum of these three statistics equals the column size. By comparing these three statistics we can identify columns we might want to remove. Columns where the Dictionary size is a lot larger than the size of the actual data are good candidates to consider for removal to optimise performance. These columns are often of the string data type. string columns use hash encoding which adversely affects performance.
So why does hash encoding adversely affect performance? In the background of Power BI reports, compression is applied to each of the columns independently to reduce the size of the data. Compression is achieved by encoding the values within that column. The type of encoding used is dependent on the data type of the values in that specific column. Hash encoding, used for the string data type, is a process where a dictionary is created for each of the distinct values within a column. Each dictionary is assigned an integer index value. Once the dictionary is created, the corresponding integer index from the dictionary is used in place of the actual string values. When each value in a string column is unique, each value has its own index and own dictionary. This requires a lot of memory. Thus, removing unused columns where the Dictionary size is a lot larger than the size of the actual data is an effective way to free up space and improve performance.
Cardinality
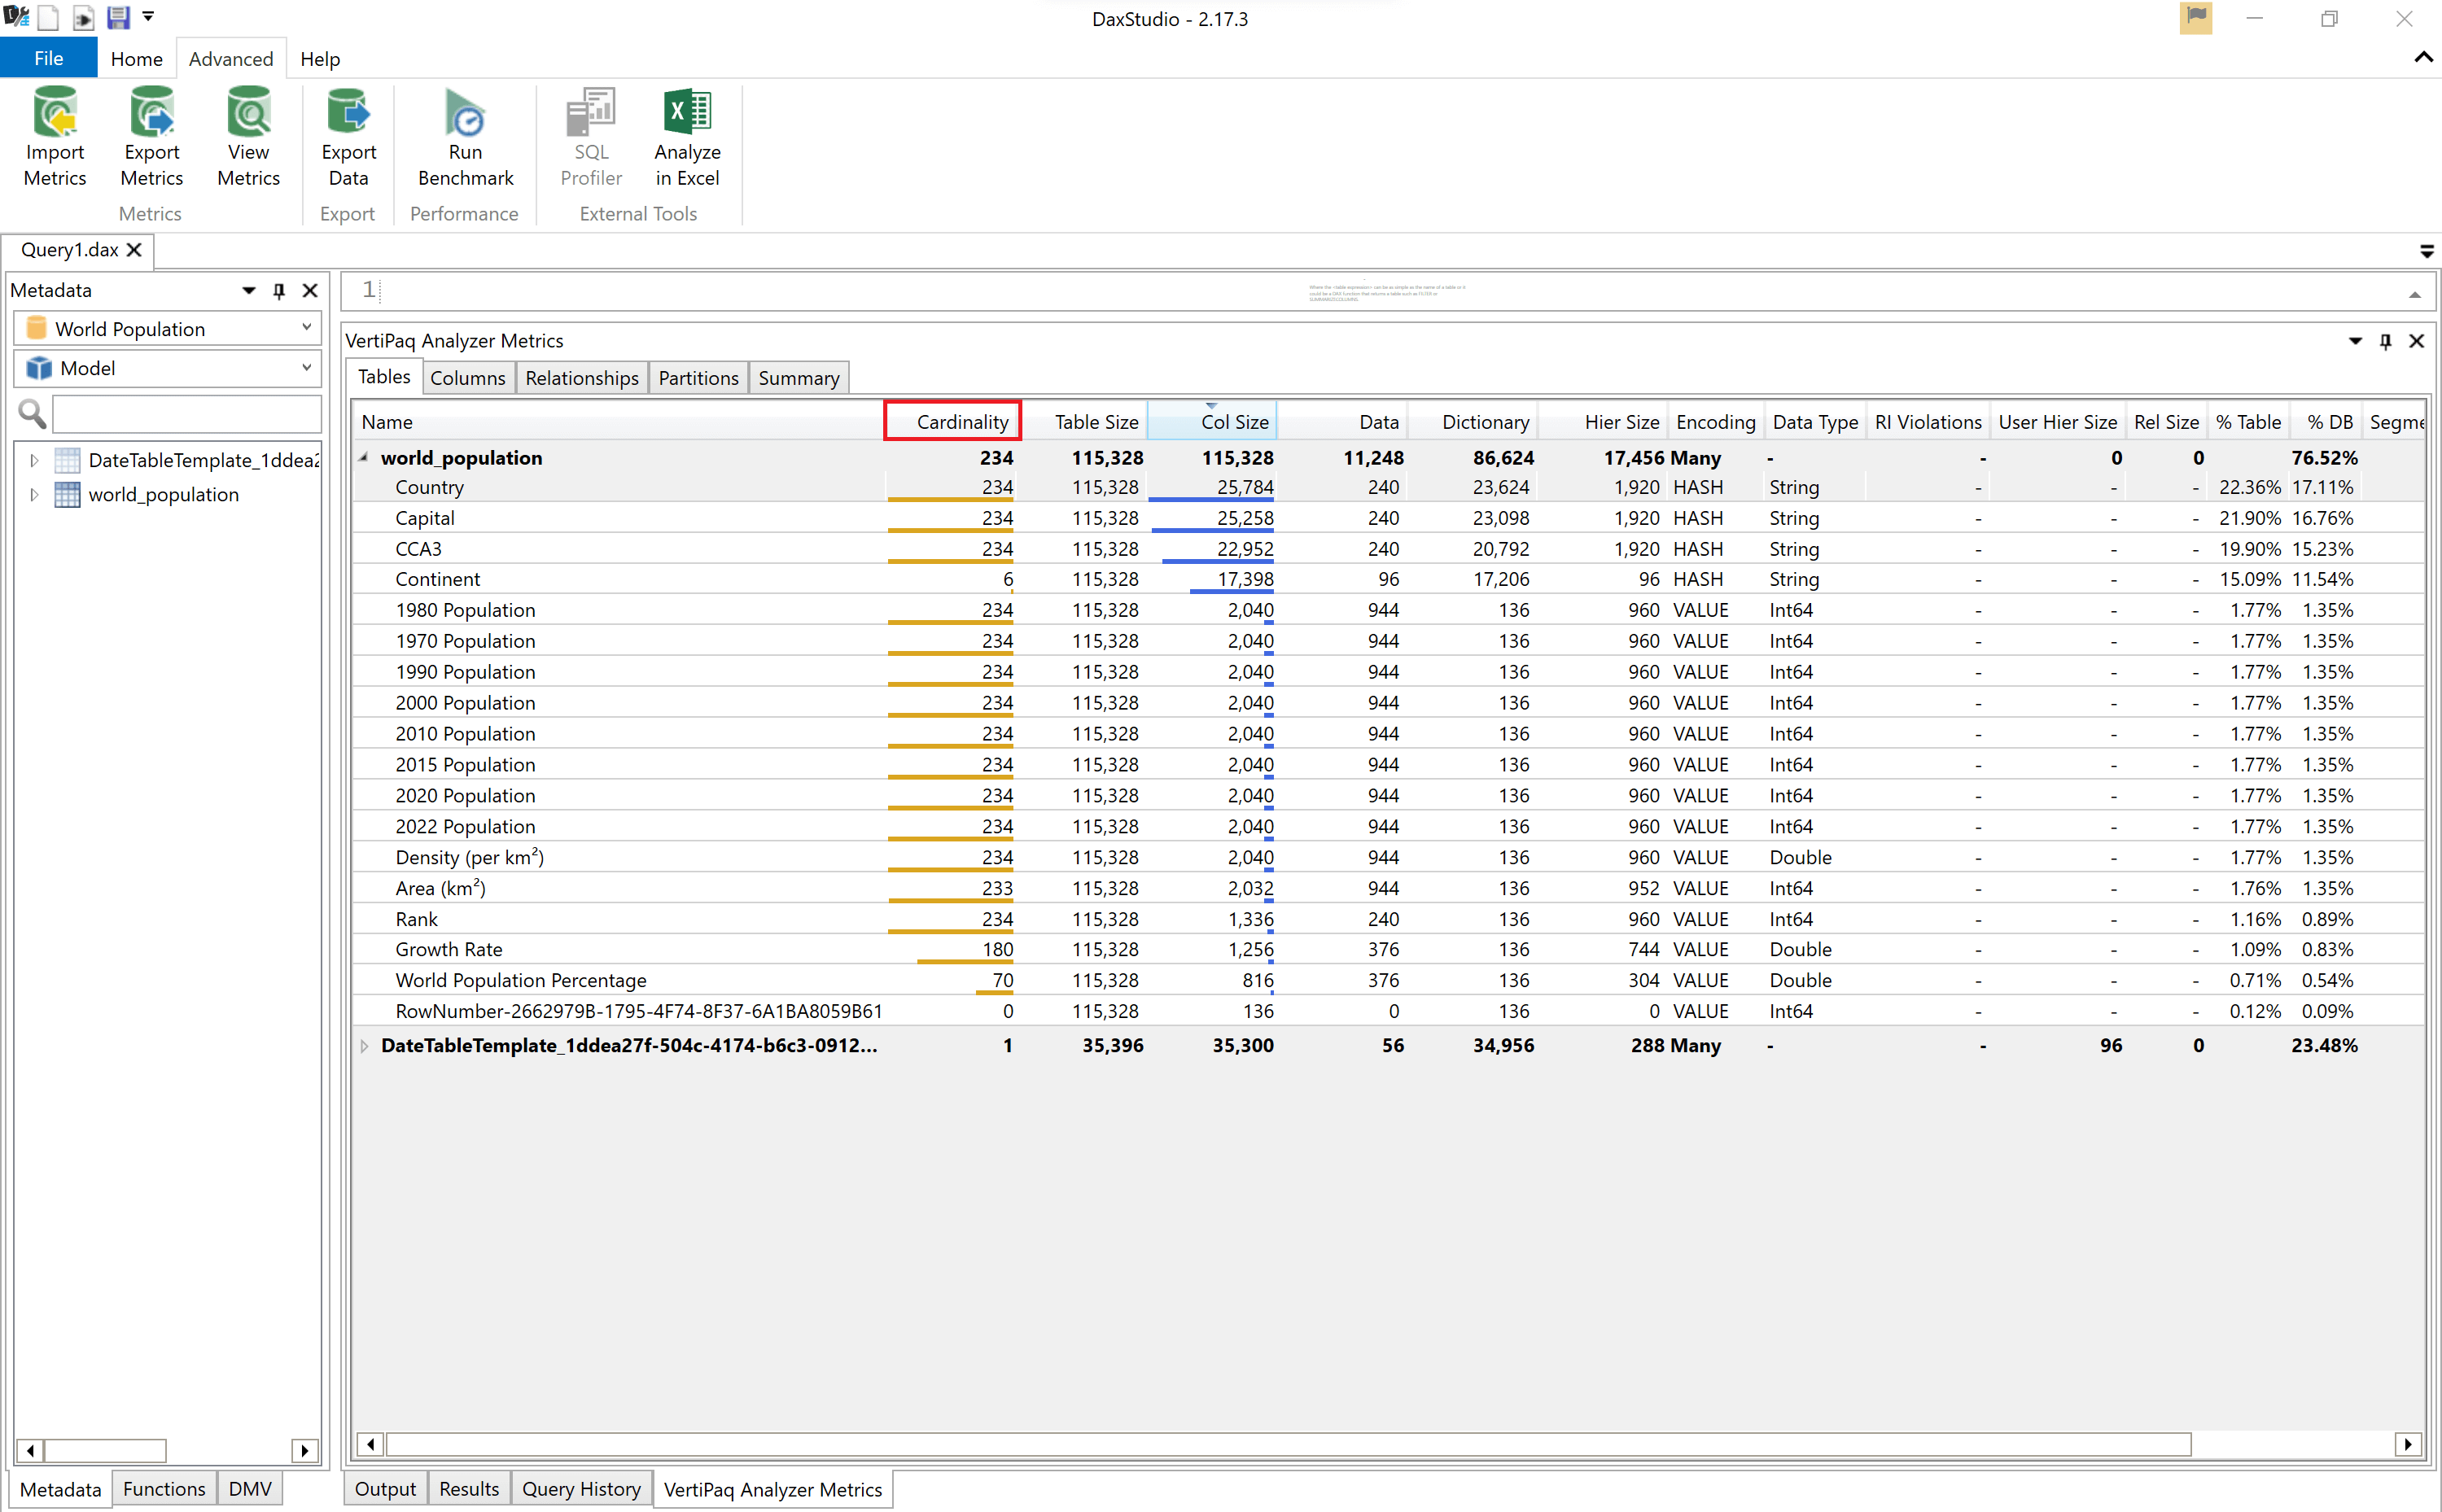
Another important statistic to look at in your data model is cardinality. The higher the cardinality, the less unique values you have and the worse the table compression is. Items with the highest cardinality therefore take up more space in the data model. So, removing unused high cardinality tables/columns can free up room in your data model and optimise performance.
Tables with the highest cardinality are most likely the 'Fact' tables within the star schema, as these tables have the most number of rows. If we look at specific columns with a high cardinality, these columns are often of the string data type. This goes back to the notion of hash encoding.
You can download Dax Studio here: Dax Studio
Best Practice Analyzer in Tabular Editor
Once you have obtained some initial recommendations from Vertipaq Analyzer, the next tool to use is the Best Practice Analyzer within Tabular Editor.

The Best Practice Analyzer in Tabular Editor is another external tool you can utilise to identify performance bottlenecks. The Best Practice Analyzer uses Best Practice rules for Power BI and tabular modeling (defined here by Michael Kovalsky: Best practice rules to improve your model performance | Microsoft Power BI and Best practice rules to improve your model's performance and design v1.1 | Microsoft Power BI to improve your model's performance. These rules can be added to your instance of Tabular Editor (view the articles above for instructions on how to load the rules) and within seconds, it scans your entire model against each of the rules and alerts you of common modeling errors and optimisations that can be made to improve the model design and performance.
The rules are divided into categories: DAX Expressions, Error Prevention, Formatting, Maintenance, Naming Conventions and finally - the category of most interest for this blog post Performance. You can see the Best Practice performance rules loaded into Tabular Editor in the image below.

When running the Best Practice rules against a sample Power BI report, we can see that 48 objects within the report are in violation of 15 Best Practice rules. The Best Practice Analyzer pinpoints precisely where these violations occur so they can be investigated and fixed if necessary.

It is important to note that the Best Practice Analyzer flags potential modeling errors. Before making any improvements or removing parts of the model, you need to ensure that you understand your data. This is so you can manually validate each error flagged by the Best Practice Analyzer and improve your model accordingly.
You can download Tabular Editor here: Tabular Editor
Performance Analyzer in Power BI Desktop
Performance Analyzer in Power BI Desktop is a useful tool to help identify which visuals are impacting the performance of your Power BI report. It evaluates and displays the real-time duration required for updating or refreshing visuals, revealing which visuals are causing performance bottlenecks. Each visual's log information comprises of the duration time, in milliseconds, to complete the DAX query and to complete visual display.
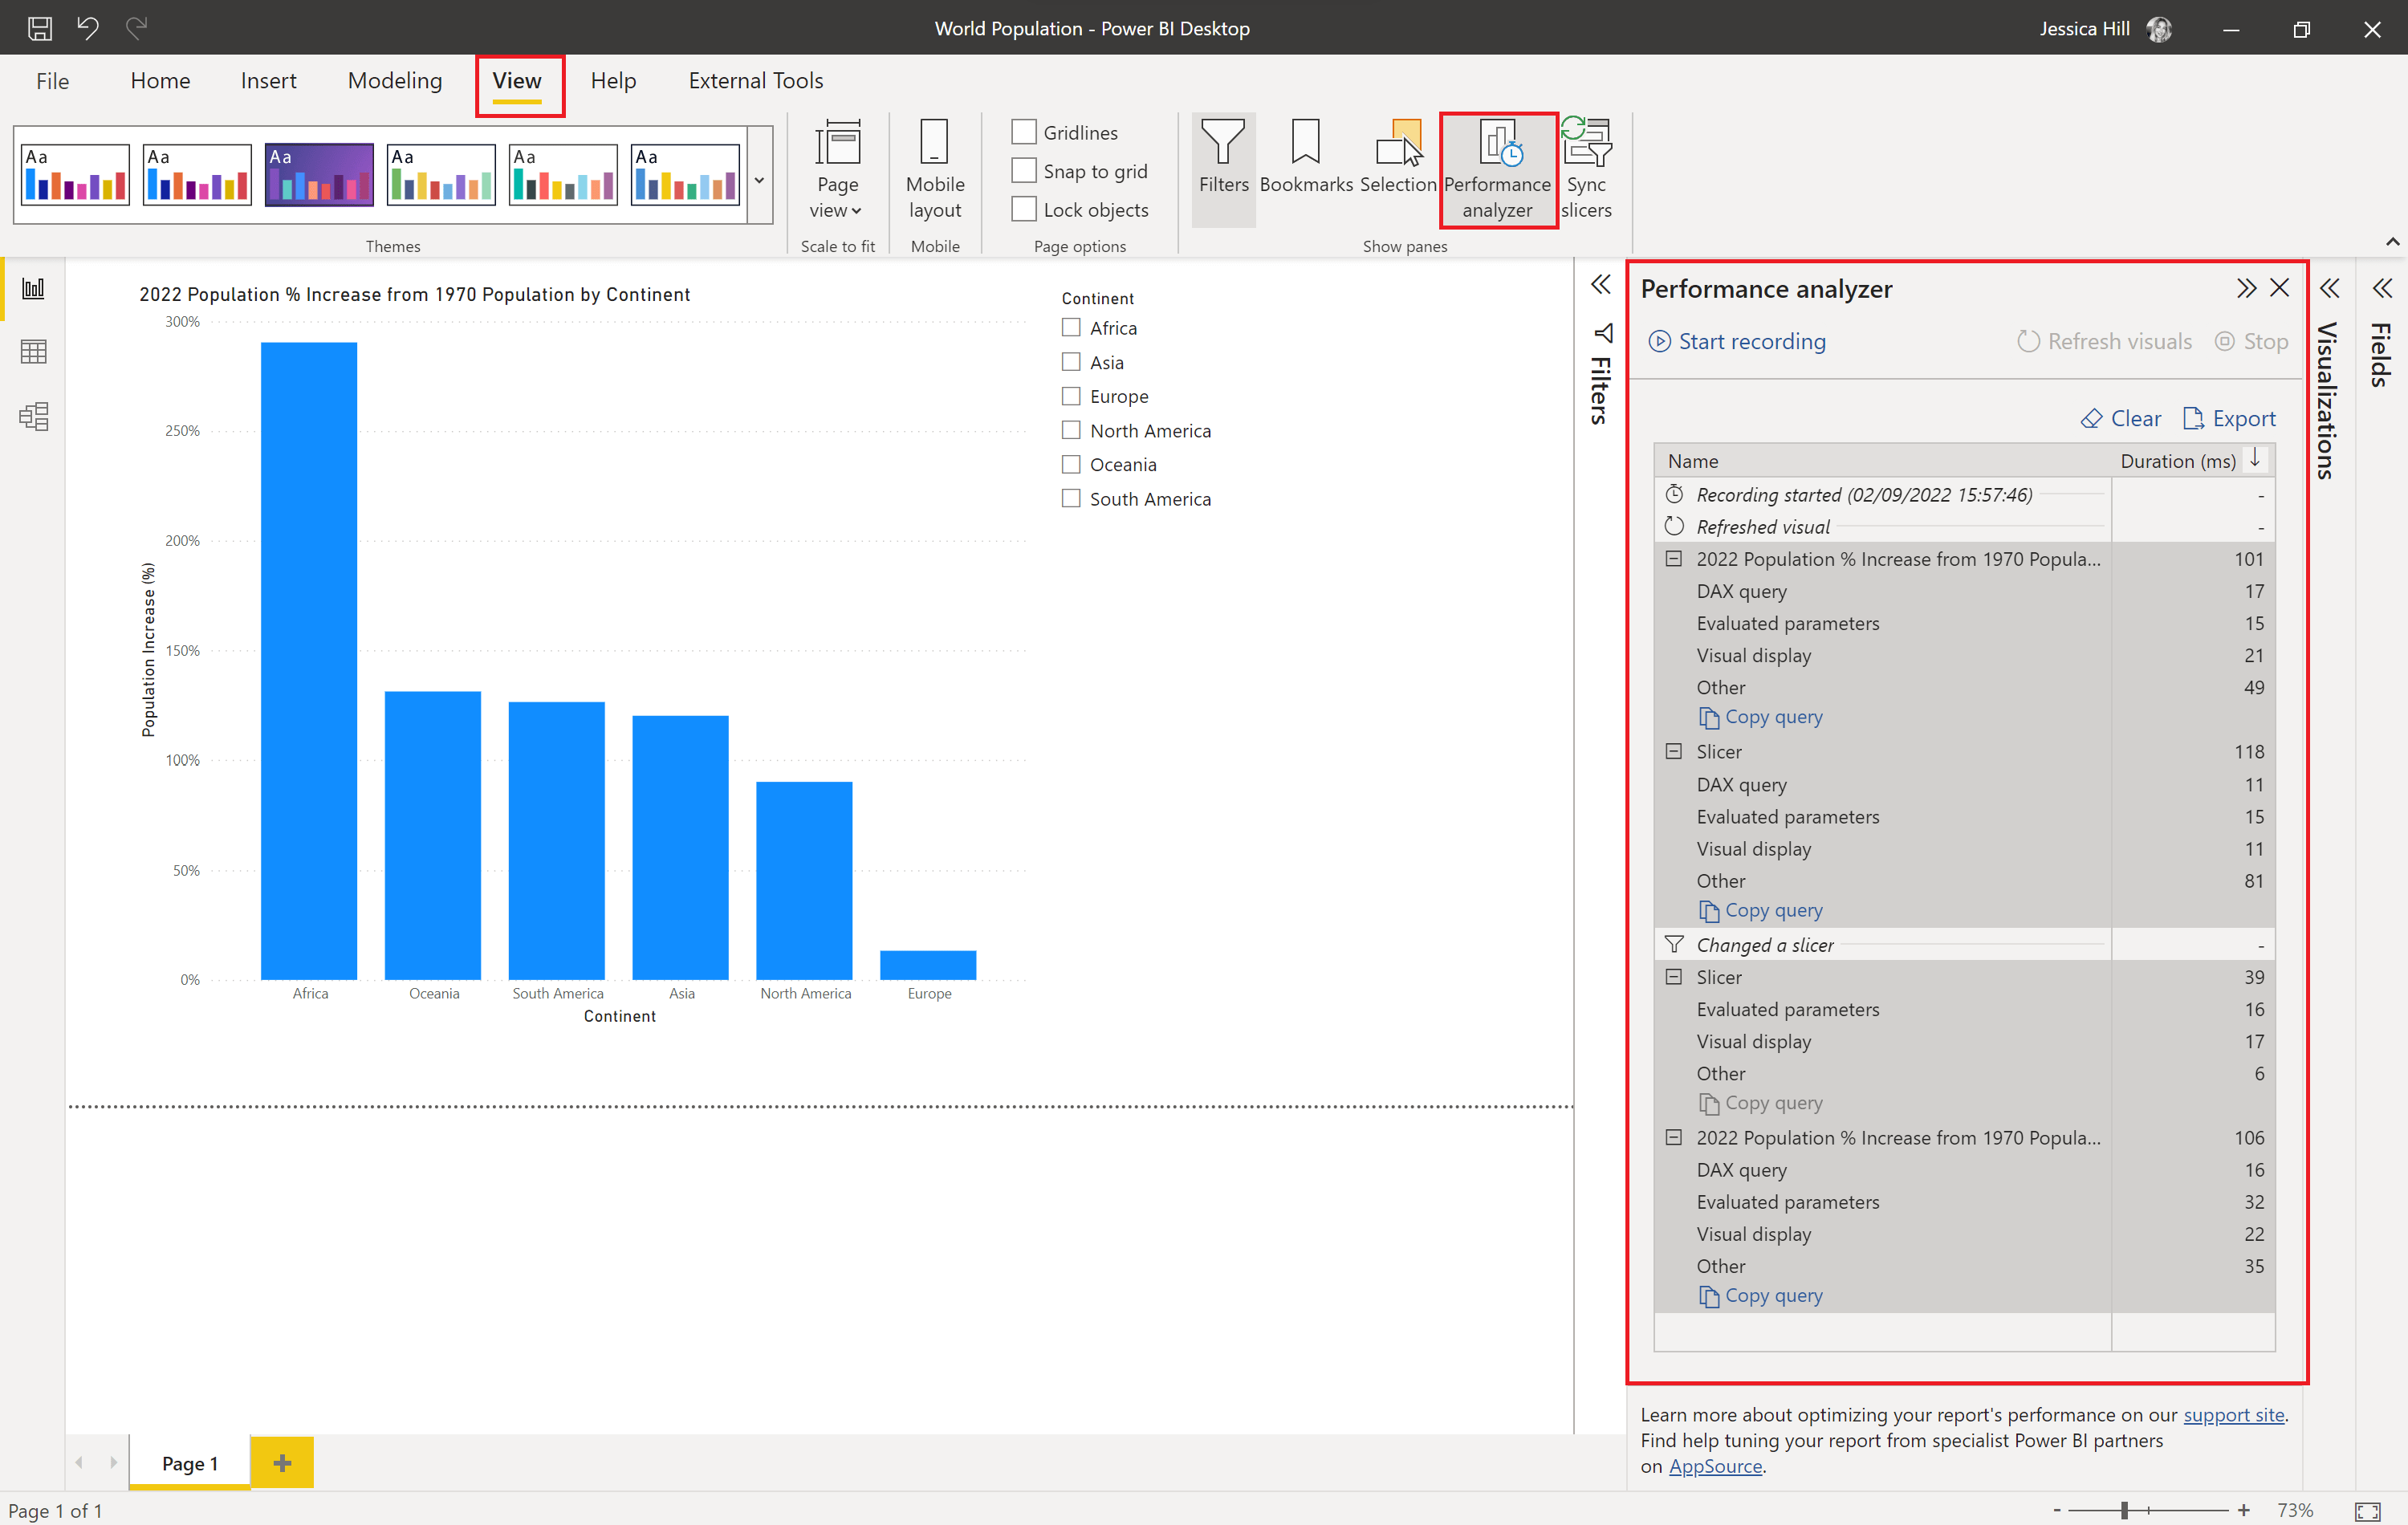
Once you have identified visuals which are impacting performance, you can then optimise the model and the DAX queries behind these visuals. One way to do this is you can press 'Copy query' within Performance Analyzer, and head over to DAX Studio. You can then run this measure in DAX Studio and leverage the Server Timings tool to generate performance information and see how the formula is being interpreted. From this, you can then optimise the DAX query and improve visual performance.
Conclusion
To ensure optimal performance of your Power BI reports, carrying out performance tuning is an essential task. However, this is not always simple as there are many factors that can affect performance. The tools covered in this blog post enable you to identify the source of performance issues at a granular level, so that you are empowered with the information needed to improve and optimise the performance of your Power BI reports.