How to dynamically choose the correct font colour based on a background colour in Power BI tables.
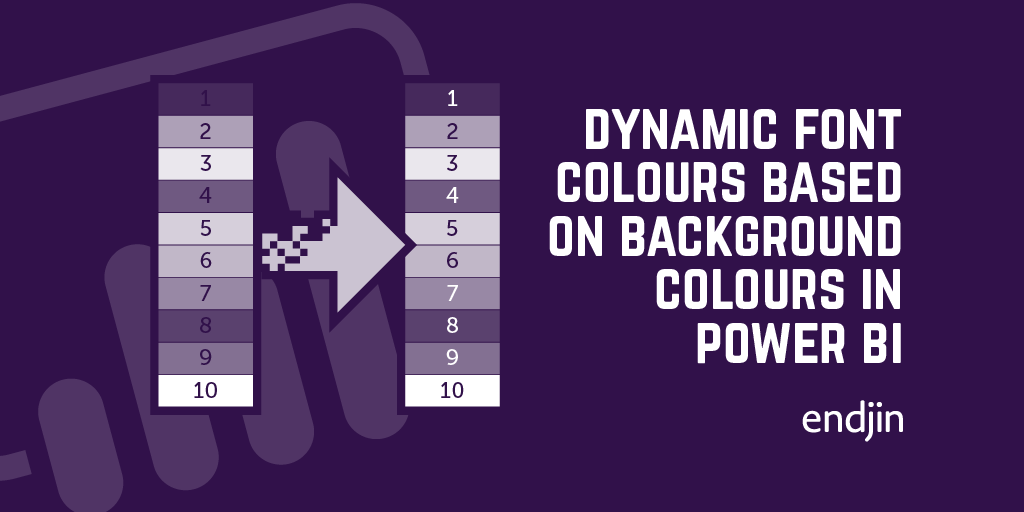
Making your Power BI reports accessible is crucial, and one important aspect is legibility. If you're using background colours to represent certain categories, then you need any text that's used in conjunction with that background to be as clear as possible.
Note: using only background colours to represent categories could make it difficult for those suffering with colour-blindness to consume your reports. Consider using background colours in conjunction with a written label (or an icon) to make the report easier to consume.
Recently, I was assigning a background colour (defined as Hex triplets) to values in a column within a matrix. I also wanted to overlay some text which showed the value for that particular cell. By default, you can only select one font colour for the values for a particular field in your tables/matrices. However, conditional formatting allows you to specify the font colour based on certain criteria.
Generally, the best option is either black or white text, depending on the brightness of the background. But how can we dynamically calculate the best option for any given background colour?
Thanks to Ilmari Karonen's answer on this Graphic Design Stack Exchange question, I could formulate a nice way to achieve this using DAX. I'm by no means an expert in colour theory, so please read Ilmari's answer to read further into the logic behind the code shown further down this blog. Here's the end result:

Method
Let's say I have the following table, which consists of a bunch of categories with corresponding colours:

Creating a table visual and adding it to the canvas results in the following default formatting (at least, with the default Power BI theme applied):

I.e. alternating white and grey rows (which is what you get with the "Default" style as per the format pane for the table visual.
To apply conditional background formatting, we hit the dropdown on the "Category" field in the visual's "Fields" pane, then navigate to "Conditional formatting" > "Background color" as per the following:

Clicking on this opens up the conditional formatting dialogue box. Since we have our colours defined in our data model, we want to create the conditional formatting rules by using a "Field value". We then select the "Colour" column in our "Categories" table.
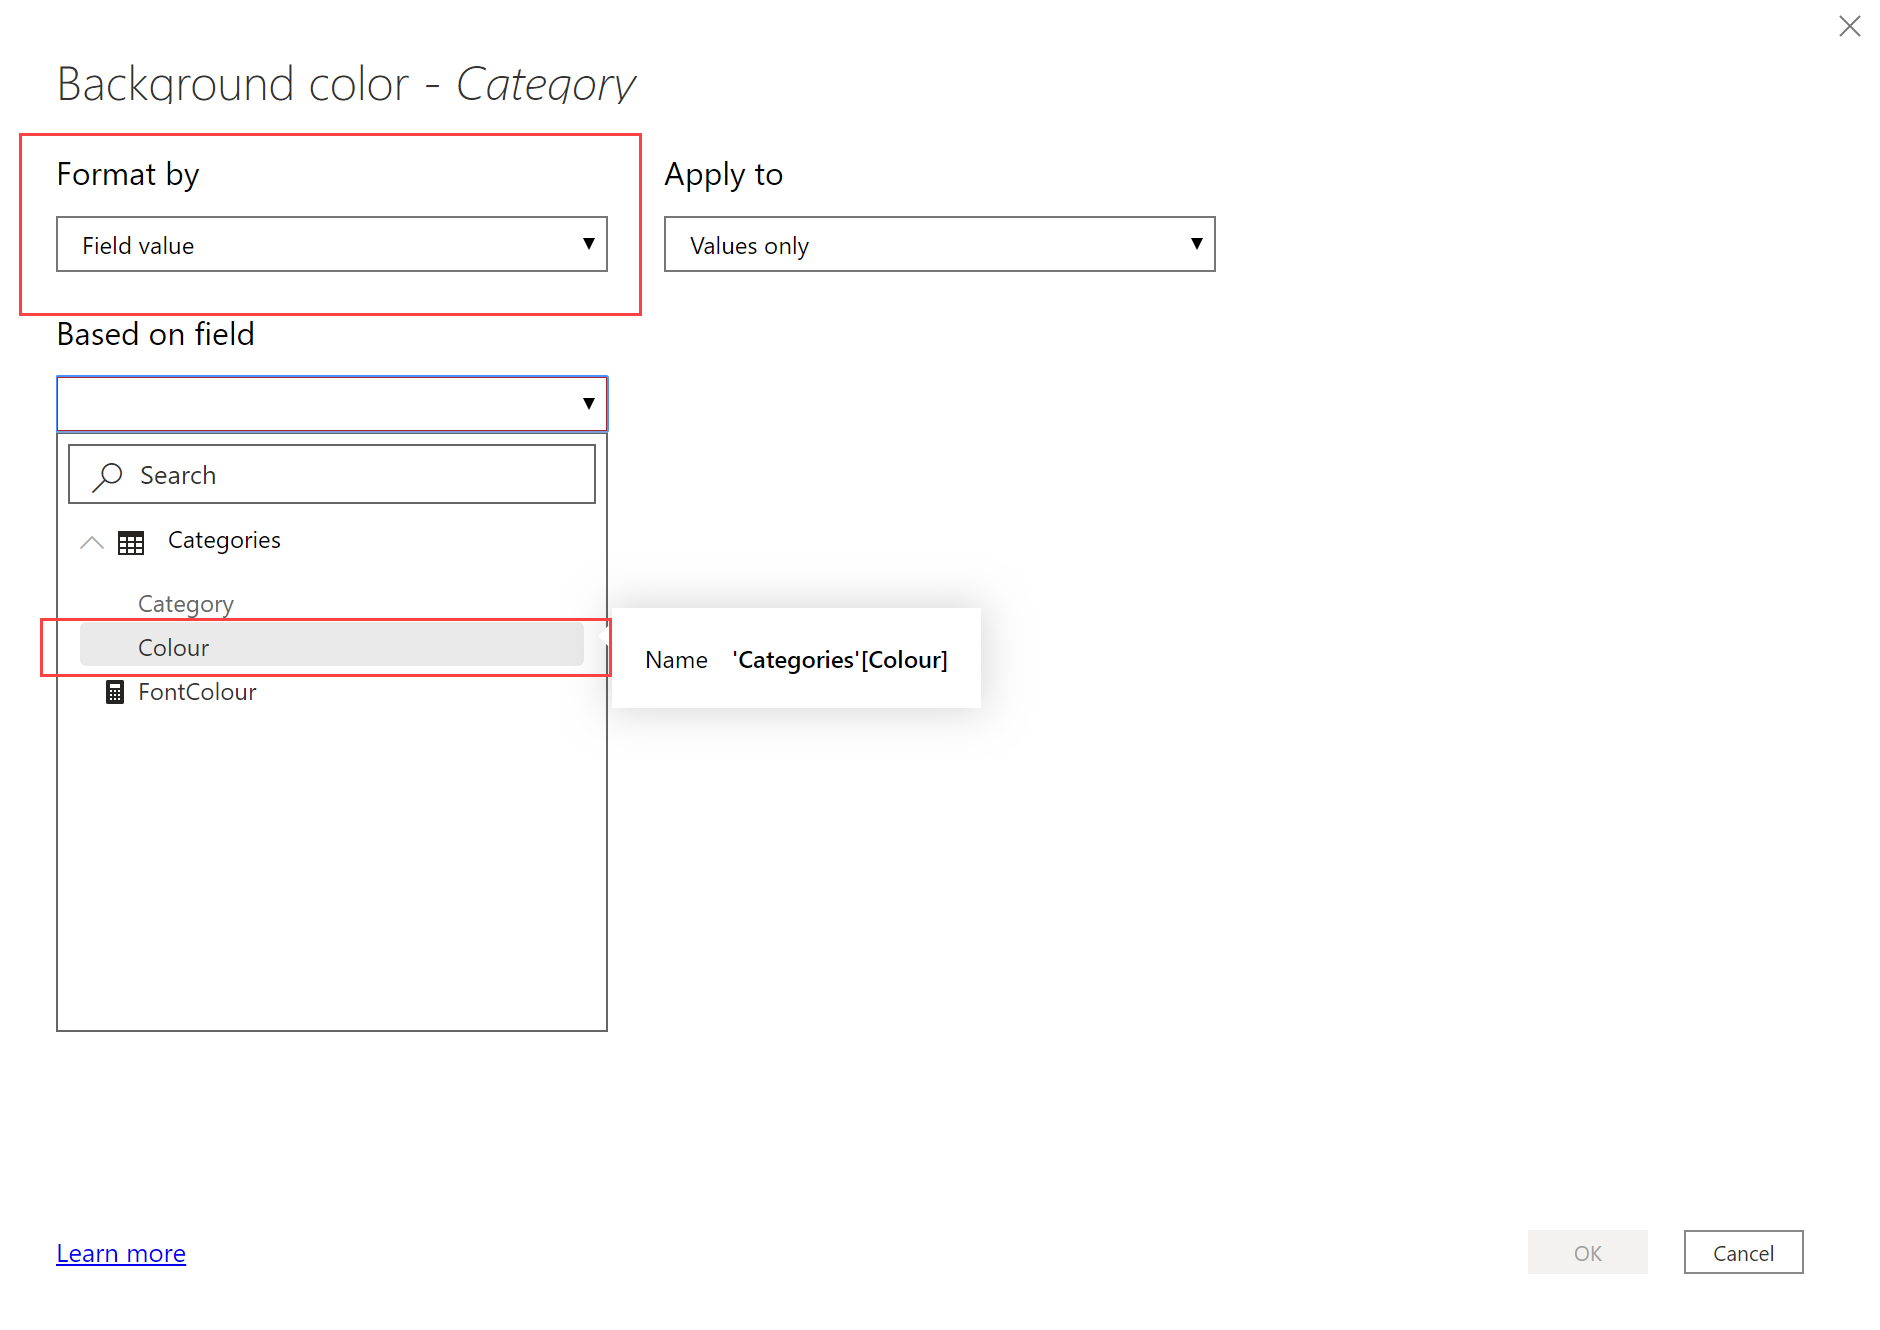
Selecting that, and hitting "OK", we can see our table with background colours according to their mappings in our data model:

We can immediately notice some issues. We can't see the value for Category 2 at all, because the background and font colour are effectively the same. Similarly, the dark blue and purple background colours make it so one has to strain to make out the values in those cells. Ideally, we need some cells to show white text, and some to show black, based on their corresponding background colour. Here comes the DAX magic to achieve this.
FontColour =
// 1. Grab the background colour for the current row
VAR selectedColour = SELECTEDVALUE(Categories[Colour])

// 2. Extract the hexadecimal value for each digit in each colour couplet, and translate to the decimal representation of that value
VAR redDig1 = MID(selectedColour, 2, 1)
VAR redDig1Number = SWITCH(redDig1,"0",0,"1",1,"2",2,"3",3,"4",4,"5",5,"6",6,"7",7,"8",8,"9",9,"A",10,"B",11,"C",12,"D",13,"E",14,"F",15)
VAR redDig2 = MID(selectedColour, 3, 1)
VAR redDig2Number = SWITCH(redDig2,"0",0,"1",1,"2",2,"3",3,"4",4,"5",5,"6",6,"7",7,"8",8,"9",9,"A",10,"B",11,"C",12,"D",13,"E",14,"F",15)
VAR greenDig1 = MID(selectedColour, 4, 1)
VAR greenDig1Number = SWITCH(greenDig1,"0",0,"1",1,"2",2,"3",3,"4",4,"5",5,"6",6,"7",7,"8",8,"9",9,"A",10,"B",11,"C",12,"D",13,"E",14,"F",15)
VAR greenDig2 = MID(selectedColour, 5, 1)
VAR greenDig2Number = SWITCH(greenDig2,"0",0,"1",1,"2",2,"3",3,"4",4,"5",5,"6",6,"7",7,"8",8,"9",9,"A",10,"B",11,"C",12,"D",13,"E",14,"F",15)
VAR blueDig1 = MID(selectedColour, 6, 1)
VAR blueDig1Number = SWITCH(blueDig1,"0",0,"1",1,"2",2,"3",3,"4",4,"5",5,"6",6,"7",7,"8",8,"9",9,"A",10,"B",11,"C",12,"D",13,"E",14,"F",15)
VAR blueDig2 = MID(selectedColour, 7, 1)
VAR blueDig2Number = SWITCH(blueDig2,"0",0,"1",1,"2",2,"3",3,"4",4,"5",5,"6",6,"7",7,"8",8,"9",9,"A",10,"B",11,"C",12,"D",13,"E",14,"F",15)

// 3. Assign the value of the Gamma exponent
VAR gamma = 2.2

// 4. Calculate the RGB values and normalize
VAR redNumber = ((redDig1Number * 16) + redDig2Number) / 255
VAR greenNumber = ((greenDig1Number * 16) + greenDig2Number) / 255
VAR blueNumber = ((blueDig1Number * 16) + blueDig2Number) / 255

// 5. Apply calculation as per Stack Exchange answer
VAR luminance = (0.2126 * POWER(redNumber, gamma)) + (0.7152 * POWER(greenNumber, gamma)) + (0.0722 * POWER(blueNumber, gamma))

// 6. If the luminance is greater than 0.5, return "Black". Else return "White".
RETURN IF(luminance > 0.5, "Black", "White")
Let's go through each section:
We select the current hex value for the background colour for the current row.
Since Hex triplets are concatenations of three pairs of numbers representing the red, green and blue components of a colour, we need to split out each digit for each colour. We do this using the MID function. We then translate this value to its decimal representation, using the SWITCH function.
Unfortunately, there isn't support for custom DAX functions, hence why there's a lot of repetition. Luckily, Hex triplets are of fixed length - namely, 6 digits - so we won't ever have more lines of code than the above (that is, unless the colour is defined in the shorthand form, in which case extra handling would need to be added).
We assign the value of Gamma as per Ilmari Karonen's answer on the Stack Exchange post.
First, Calculate the RGB values as numbers between 0 and 255. Then, as per the post, normalize the values to between 0 and 1.
Apply the luminance calculation as per the post. This includes the coefficients that are weighted such that the "Green" component has more prominence, for the reasons elaborated in Ilmari's post. Notice we're using the DAX POWER function to apply the gamma exponent to each number.
Finally, apply the condition. If the luminance is greater than 0.5, return "Black". Else return "White".
To apply this logic to the text in our table, we perform similar steps to the steps we took to apply the background colour. First, we hit the dropdown on the "Category" field in the visual's "Fields" pane, then navigate to "Conditional formatting" > "Font color" as per the following:

Once we see the dialogue box, we again want to navigate to the "Field value" option in the "Format by" dropdown. This time, however, we have our logic defined in a measure as opposed to a column in our data model. The conditional formatting doesn't care, though, as long as it has validated that the measure returns a value that's compatible to be used for the current operation (i.e. that the measure returns the value of a colour).
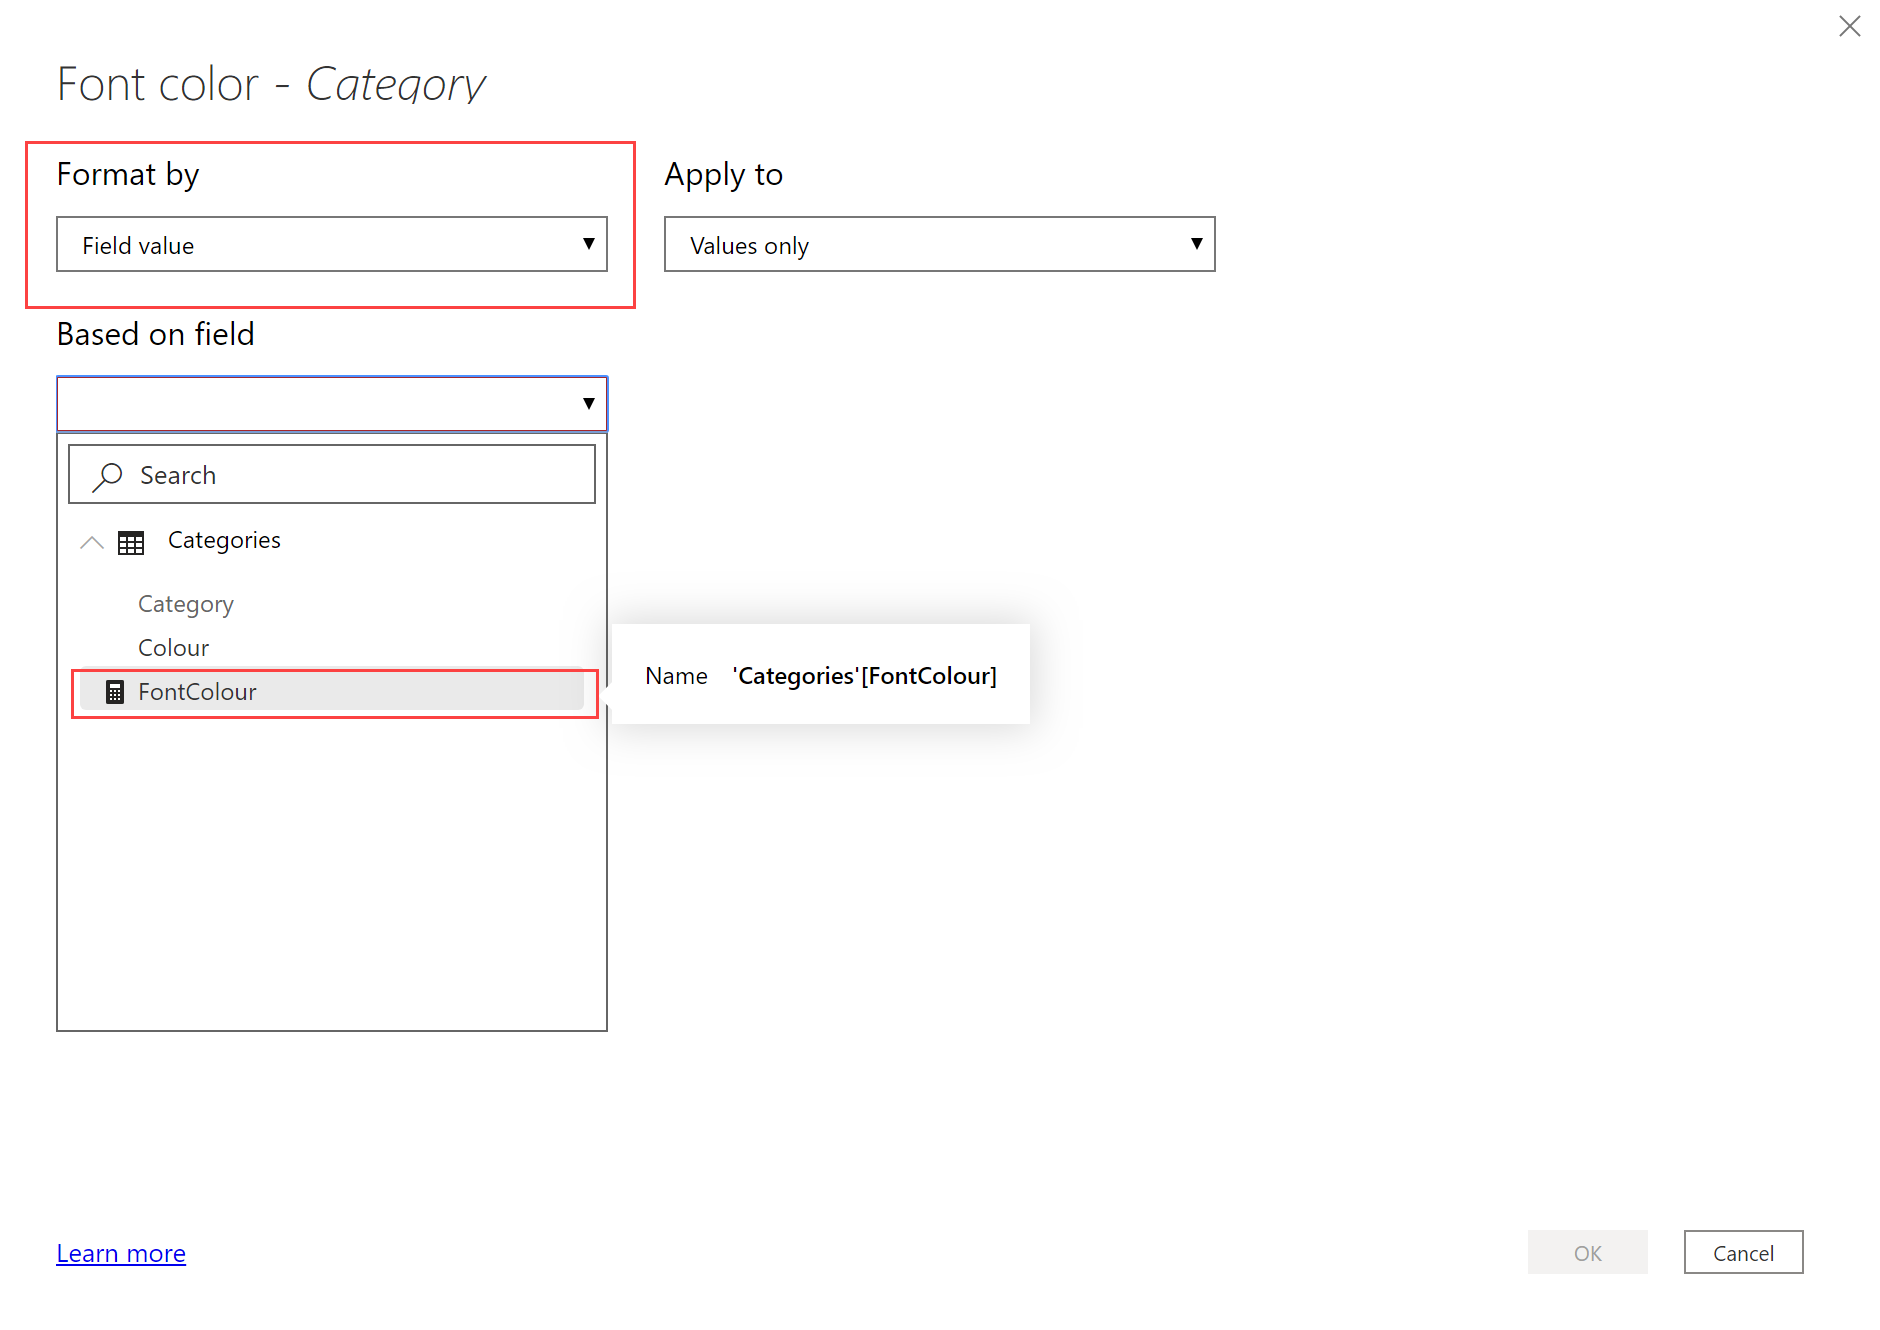
Selecting our measure, and clicking "OK", we finally get the result we've been after:

So, the logic in the measure has determined that 7 of those background colours are dark enough to warrant a white font, and 4 a black font. But the main thing is, all of the values are now perfectly legible.
Neat, right?


