Browse our archives by topic…
Visualisation

Learning from disaster: a Titanic Power BI report walkthrough
In Paul Waller's final, and posthumously published blog post, he takes you through a creative walk-through of the Titanic Power BI Report he created with Barry Smart.
How to Build Mobile Navigation in Power BI
This is follow guide to designing a mobile navigation in Power BI, covering form, icons, states, actions, with a view to enhancing report design & UI.
Power BI Images That Pop: Intuitive, easy-to-maintain reports
Explore integrating icons, pictograms and images into Power BI in the optimal way to enhance the user experience and minimise effort required to build and maintain reports.
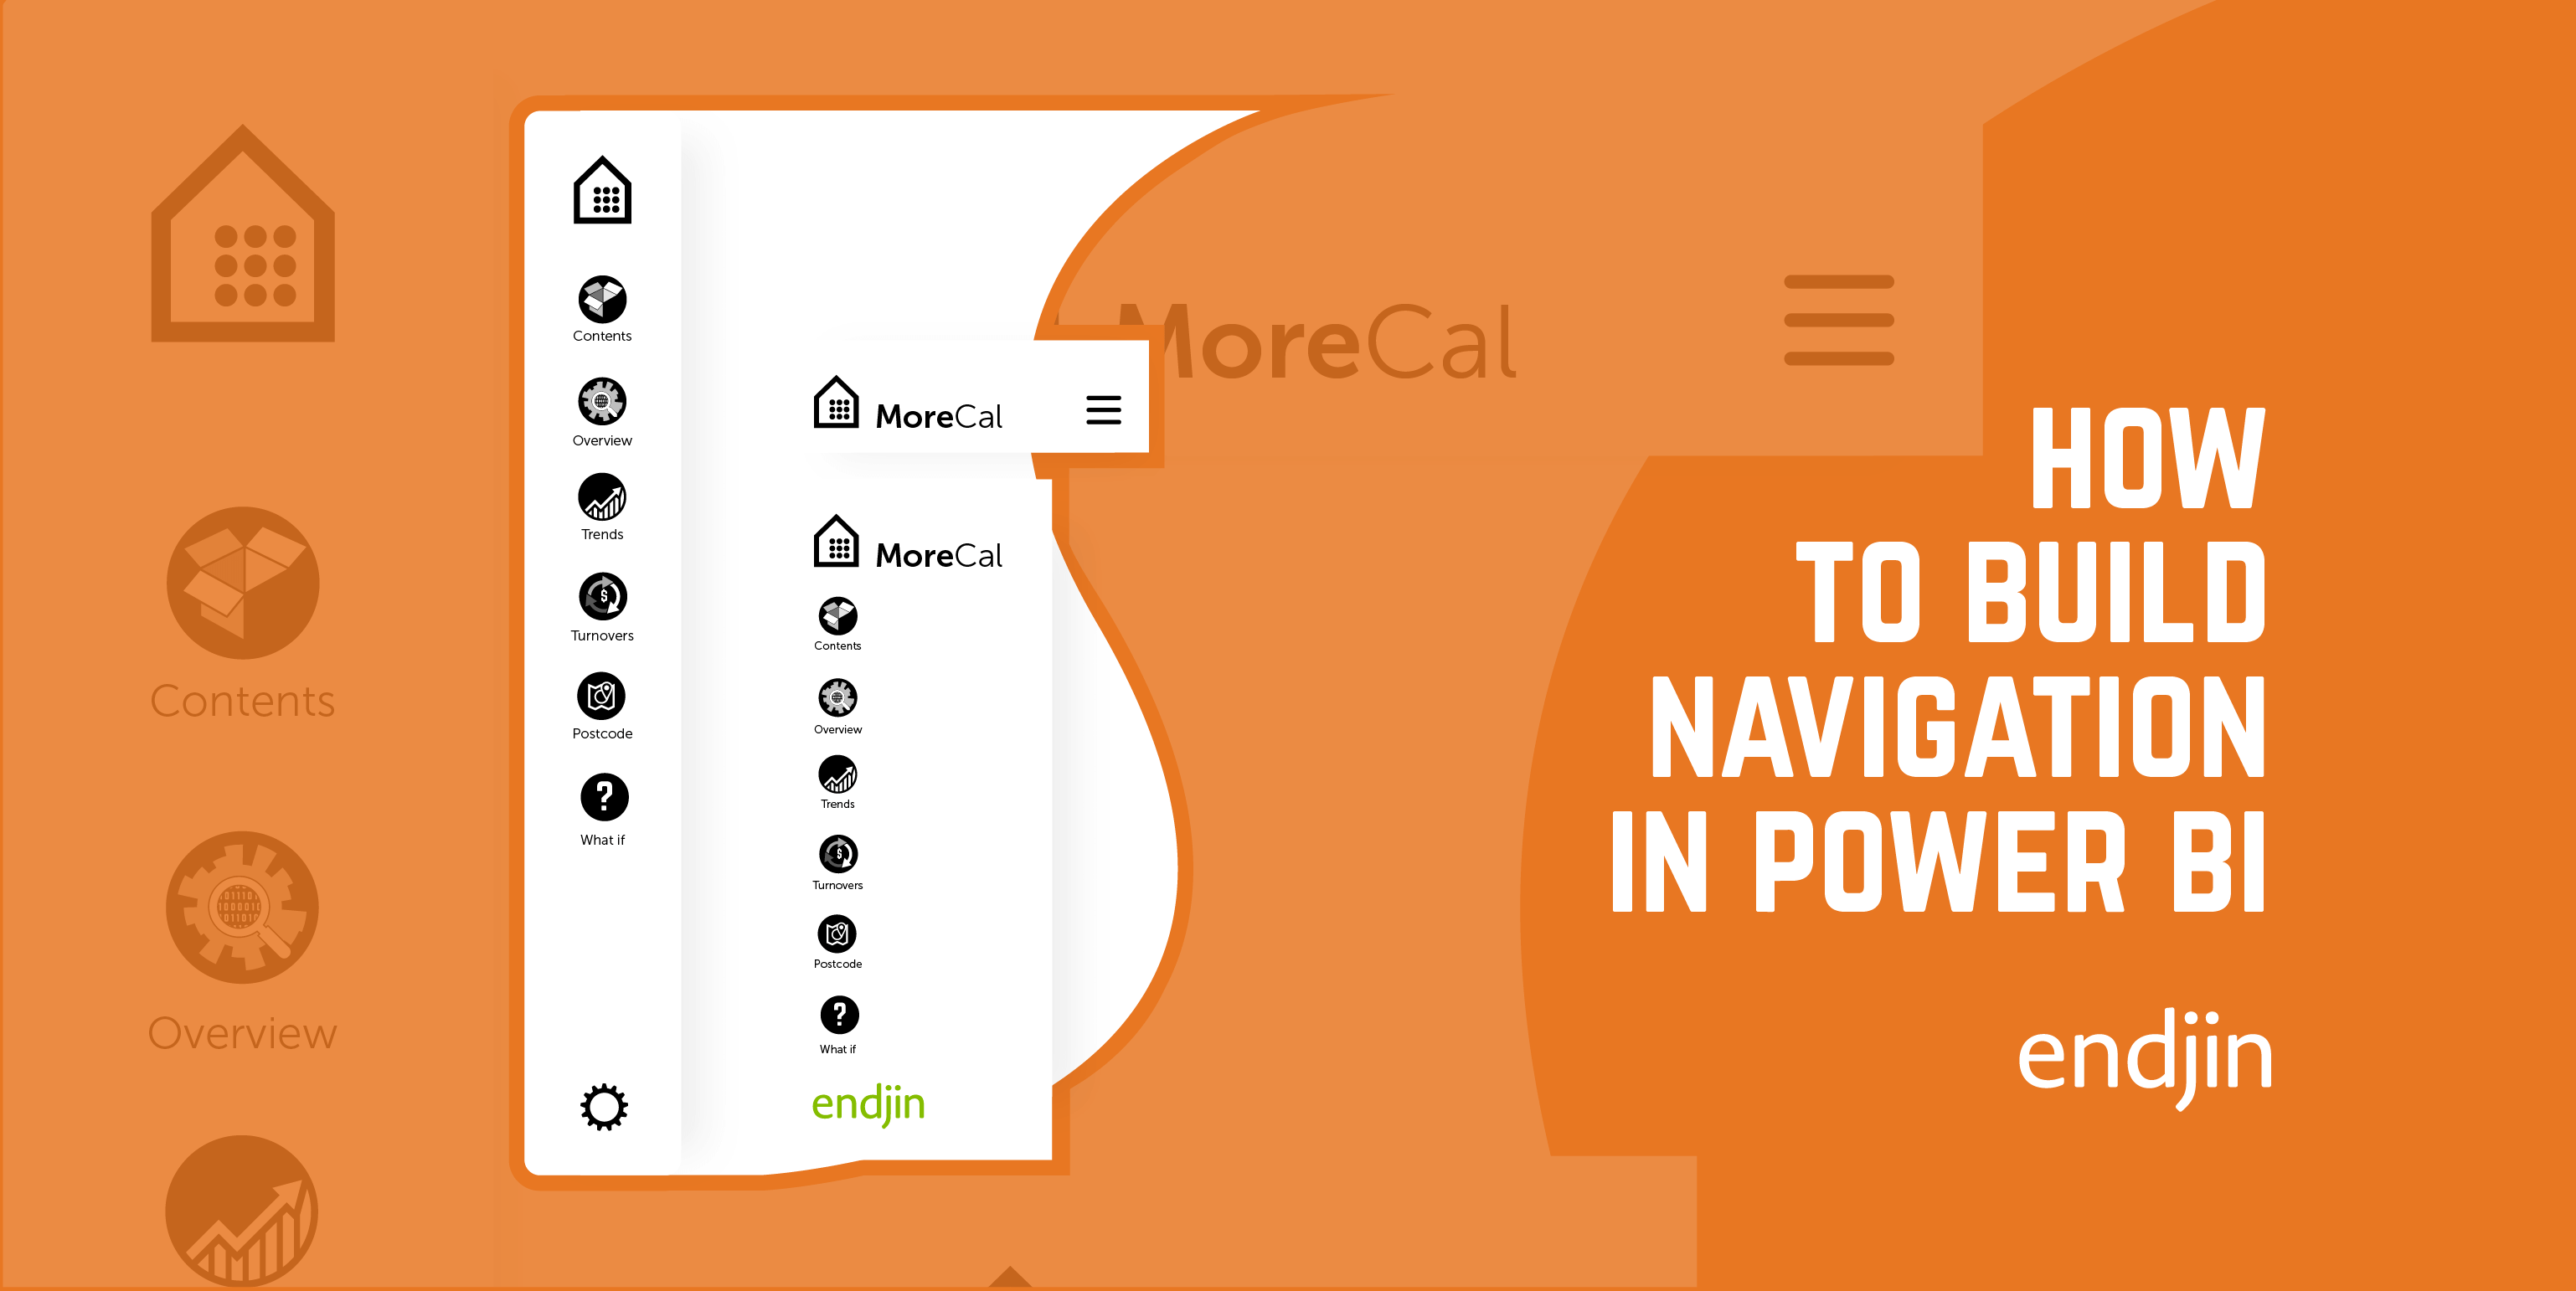
How to Build Navigation into Power BI
Explore a step-by-step guide on designing a side nav in Power BI, covering form, icons, states, actions, with a view to enhancing report design & UI.

Developing a new JSON Schema Brand and Website
Discover Paul's guide on expanding brand collateral for organizations through effective website development and design strategies.
Styling and Enhancing Model Driven Apps in Power Apps
Discover a concise guide on improving Model Driven Power Apps styles with step-by-step instructions for a polished user experience.
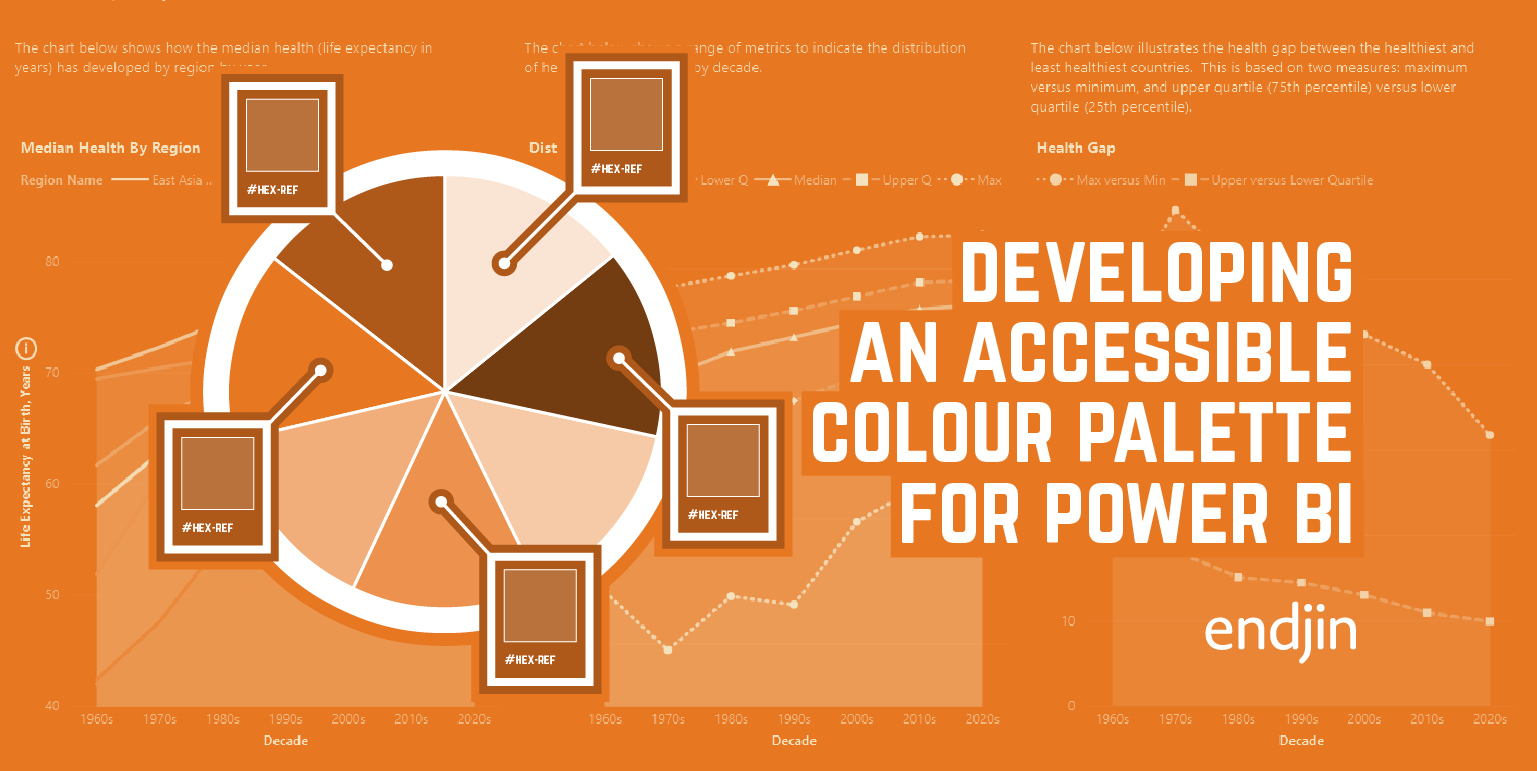
How to develop an accessible colour palette for Power BI
Explore how we developed an accessible color palette for Power BI reports, considering color vision deficiency and data visualization.
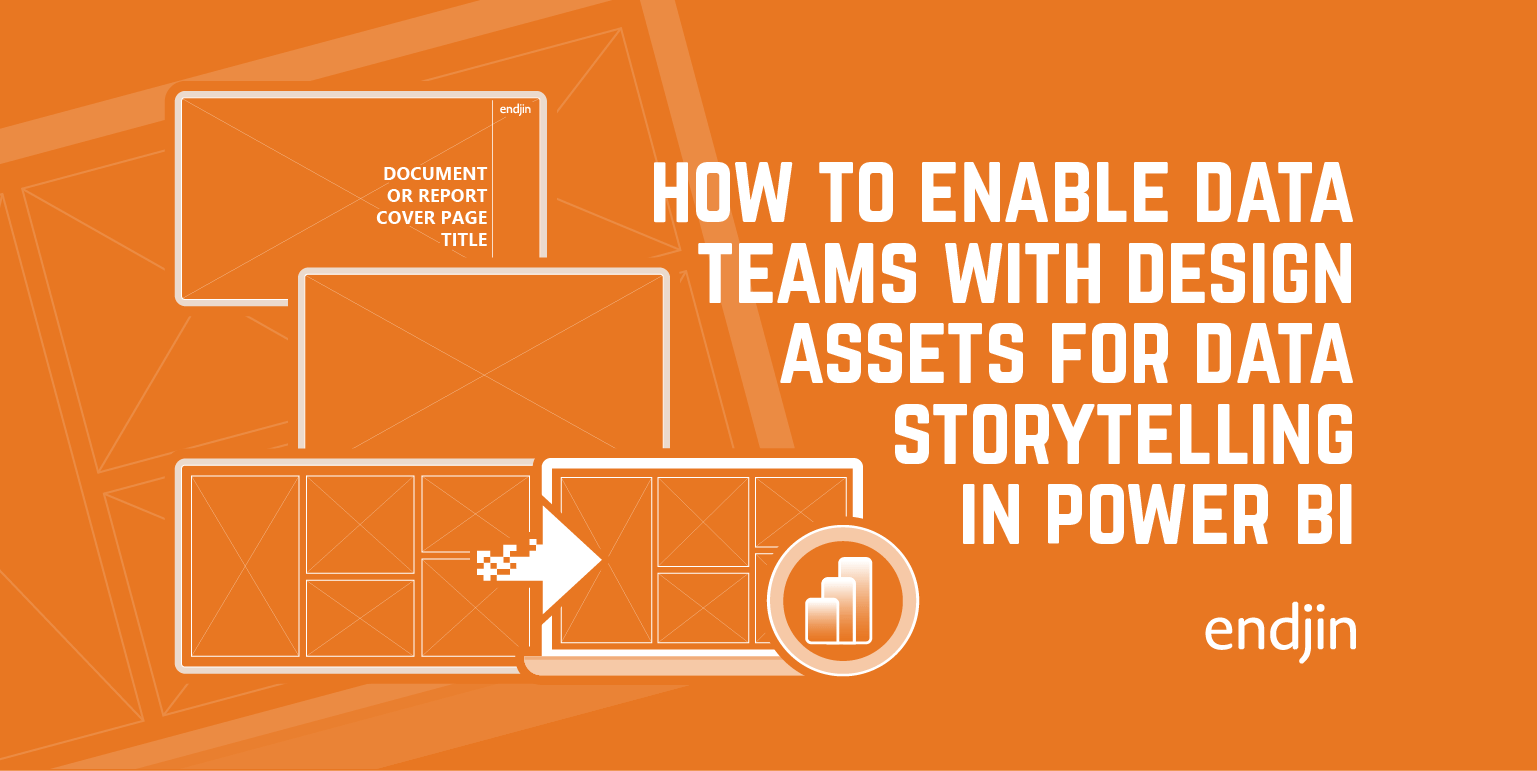
Design assets for impactful data storytelling in Power BI
In this post we will talk through how to expand on a data team's creative skillset, without access to specialist photo editing software such as Photoshop or Illustrator.

Dynamically switch Power BI measures with Field Parameters
Power BI's Field Parameters feature lets users toggle between measures in a single visual with no advanced modelling. Here's how to set it up, plus a DAX-based workaround for when you need more control.
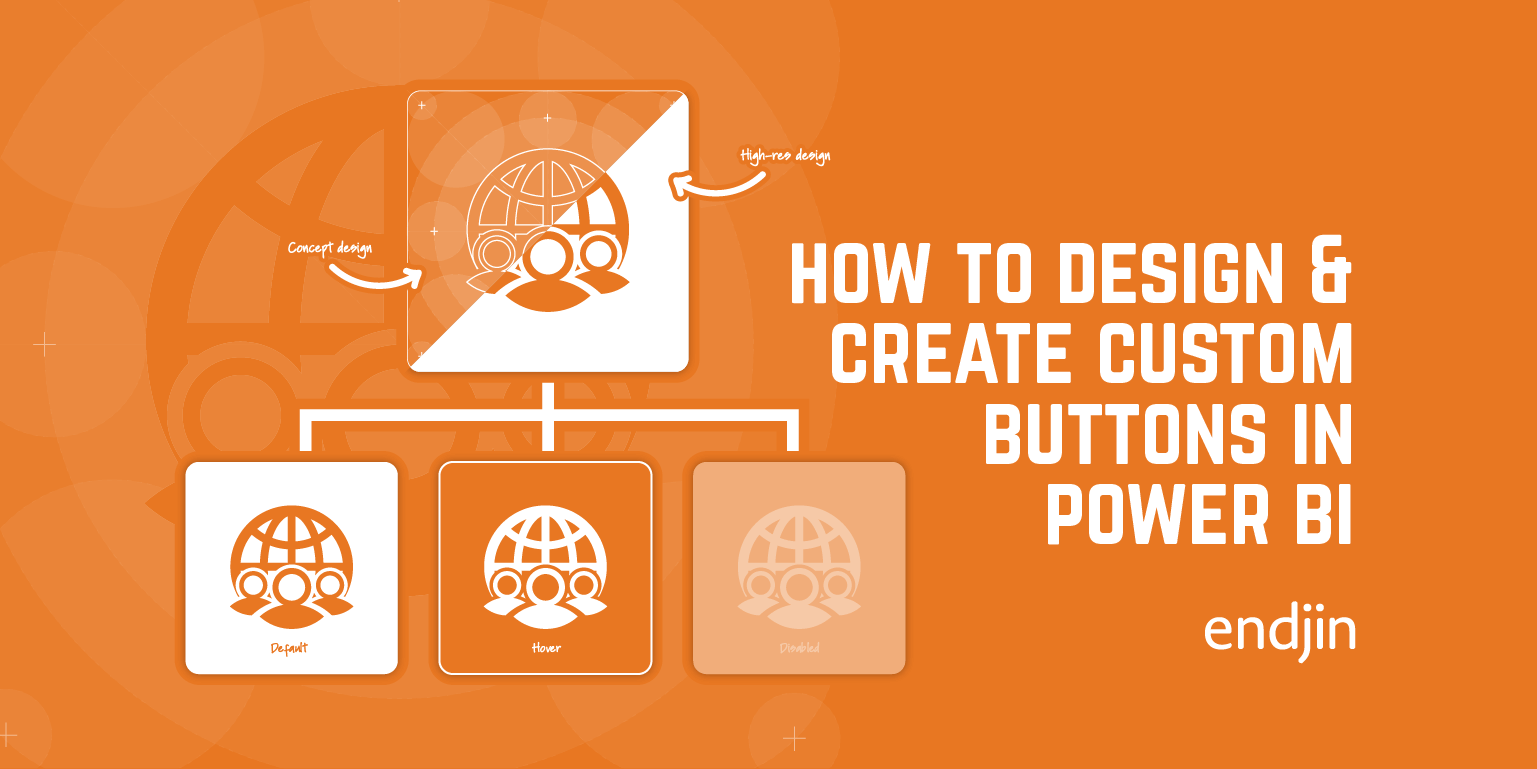
How to Create Custom Buttons in Power BI
Explore a step-by-step guide on designing custom buttons in Power BI, covering shape, form, icons, states, actions, and enhancing report design & UI.
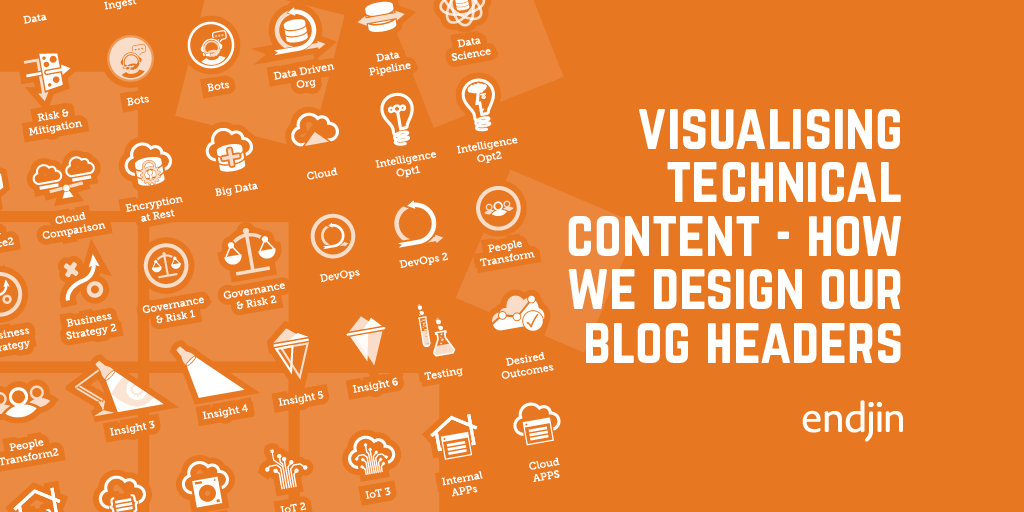
Visualising Technical Content - How we Design our Blog Headers
In this post we will be talking about our graphic process from conception to finalisation. We will look at Icons, Pictograms, Ideogram, and how we utilise this form of design to illustrate abstract technical concepts within our blog header graphics.

How to Build a Branded Power BI Report Theme
Explore translating a company's brand into Power BI reports and extending their visual identity to include the Power BI platform.
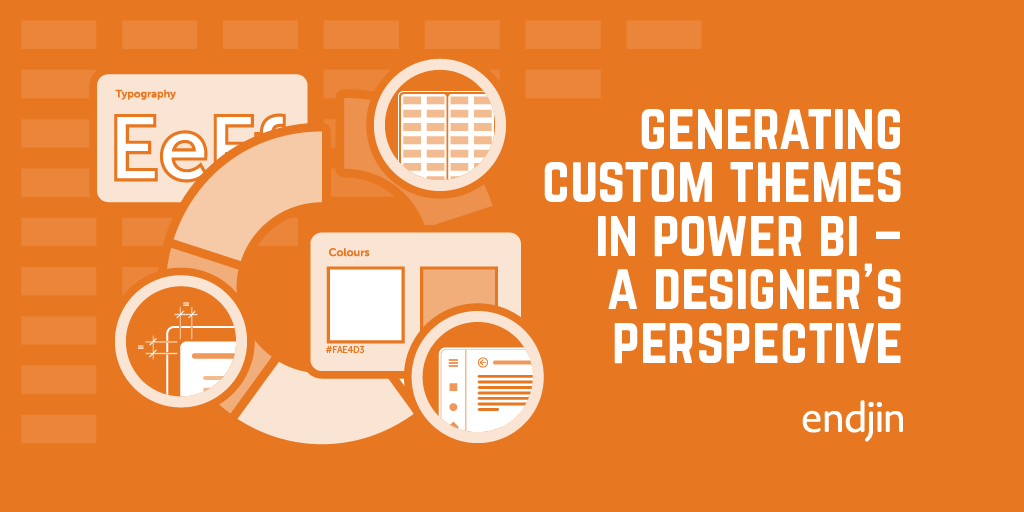
Generating custom themes in Power BI – A designer's perspective
Explore custom Power BI themes and learn tips for styling reports, pushing beyond your comfort zone for enhanced data visualization.
Picking contrasting font colours in Power BI tables
Boost Power BI report readability with dynamic font colors for diverse backgrounds, ensuring clear text display and enhanced accessibility.
Guardian Masterclass - An introduction to Data Visualisation
A few years ago, I attended a Guardian 1-day Masterclass - Introduction to Data Visualisation. What I did not know then was that it would have a profound effect on how I view design. This blog is a recap of that day and reference points to consider when designing and creating graphics for data visualisation.

Donut chart corkscrew entry animation with d3.js
In this post we show a smooth entry animation for D3.js donut (or pie) charts, using a combination of a sweep and a zoom to give a corkscrew-like effect.
Power BI DirectQuery report with multiple SQL DBs via Elastic Query
Learn to build a Power BI dashboard using DirectQuery and ElasticQuery across multiple databases with Alice Waddicor.
Querying the Azure DevOps Work Items API directly from Power BI
Discover Azure DevOps Work Items features, use RESTful API for insights, and Power BI visualization in our step-by-step guide.