Analyzing WPF performance by enabling ETW


We recently did some performance tuning work for a company whose main product is a Windows desktop application. They were updating it to use the version of WPF that runs on .NET 8.0 today, and had run into some performance issues. Some of us here at endjin have been using WPF for a very long time. (I even co-wrote one of the first books on WPF.) So we knew that ETW (Event Tracing for Windows) is a vital tool for understanding a WPF application's performance characteristics.
We were surprised at how hard it has become for those new to WPF to discover how to tap into WPF's ETW instrumentation. There doesn't appear to be any documentation on how to make use of it. It's not actually hard to do, it's just hard to discover how to do it.
ETW manifests
ETW is designed to be able to collect very high volumes of data with very low overhead, so it records data in a very dense binary format. To be able to make sense of this data, ETW viewer applications need a description of the types of events an ETW source can produce. Conventionally, this information is supplied in the form of a manifest.
The .NET Framework installer puts WPF's ETW manifest in C:\Windows\Microsoft.NET\Framework\v4.0.30319\WPF. If you have .NET FX installed, that folder will include a wpf-etw.man file declaring every kind of event WPF has to offer. For years WPF ran only on .NET Framework, so that was the one and only place you had to look.

The first few versions of .NET Core were very much cross-platform, and since WPF runs only on Windows, it was not included. But that changed with .NET Core 3.1. By this time Microsoft had decided to focus all future .NET development effort on .NET Core (as it was called then; that was the predecessor of what we now just call .NET), and to help people move off .NET Framework, they made WPF available on the Windows version of .NET Core 3.1. But when they did this, it seems that ETW didn't quite get as much attention as it could have done. It all still works, because all of the ETW instrumentation code was retained but, apparently the .NET installer doesn't put a copy of the WPF ETW manifest on your machine, and there doesn't seem to be any documentation on how to use it.
In fact, you don't technically need the manifest to be in a standalone file. It is possible for ETW providers to be self-describing, meaning that in cases where the ETW consumer doesn't already know exactly what events are available, the provider can be induced to emit at runtime all of the information that would normally be found in the manifest. Most .NET-based ETW providers can do this, and the WPF provider is no exception.
The one problem with this is that an ETW provider won't emit anything unless you ask it to. And if you don't already have the manifest, how are you supposed to know that there's a provider there at all? (You can run logman query providers to list registered providers, but the .NET installer doesn't register the WPF provider, so you won't see it.)
You need to know a provider's name to enable it. A provider can tell you its name, but it will do so only if you have enabled it. So it will only tell you its name if you already know its name.
Collecting WPF ETW data
You will need a tool capable of capturing and displaying ETW data. I find the quickest way is to use Microsoft's PerfView tool. This is a pretty ancient tool with a rather clunky UI, but it continues to be maintained, and you can get up and running in minutes.
If you open PerfView's Collect menu and select Run, a dialog opens enabling you to specify the application you want to run (use the full path to your WPF executable) and the name of the file in which to collect ETW data. To collect WPF data, you'll need to expand the Advanced Options section at the bottom.

Unfortunately, although the Advanced Options section offers a Provider Browser button, you won't be able to find the WPF provider in here because the .NET runtime installer doesn't register it.
Fortunately, PerfView provides a textbox where you can specify a list of provider names. The WPF provider's display name is Microsoft-Windows-WPF but using that appears not to work. You need to know its real name, which is E13B77A8-14B6-11DE-8069-001B212B5009. You put this into the Additional Providers textbox. In fact you need slightly more than that: PerfView requires two settings after the name to configure which events you want to see. If you want to see everything WPF has to offer, use this:
E13B77A8-14B6-11DE-8069-001B212B5009:*:*
You can put numbers instead of the asterisks if you want to be more selective. For example, this only collects events WPF identifies as relating to performance:
E13B77A8-14B6-11DE-8069-001B212B5009:2:*
Note the 2 instead of the first *. How on earth are you supposed to know what to put there? Well the .NET runtime installer might not put the WPF ETW manifest in a separate file on your machine, but it's in the source for WPF up on GitHub. If you look at the section at https://github.com/dotnet/wpf/blob/4120cfc5d2a6515c1dceac5b509b92aa7ea80f97/src/Microsoft.DotNet.Wpf/src/Shared/Tracing/wpf-etw.man#L23-L36 you'll see all of the 'keywords' it uses, and the corresponding values that you can put into this setting. (This is a bitfield, so you can combine values. The value 6 would capture both performance and text related ETW events.) The second asterisk can be replaced with a verbosity level—see https://learn.microsoft.com/en-us/dotnet/framework/performance/clr-etw-keywords-and-levels#etw-event-levels
If you want to collect data only from the WPF provider, and not from any other providers, be sure to uncheck all the other boxes in the Advanced Options section:

You can now click the Run Command button. PerfView will launch the executable you told it to run, and will collect WPF telemetry from that process. Once you exit your WPF application, PerfView performs some processing of the resulting files, and then opens its event view:
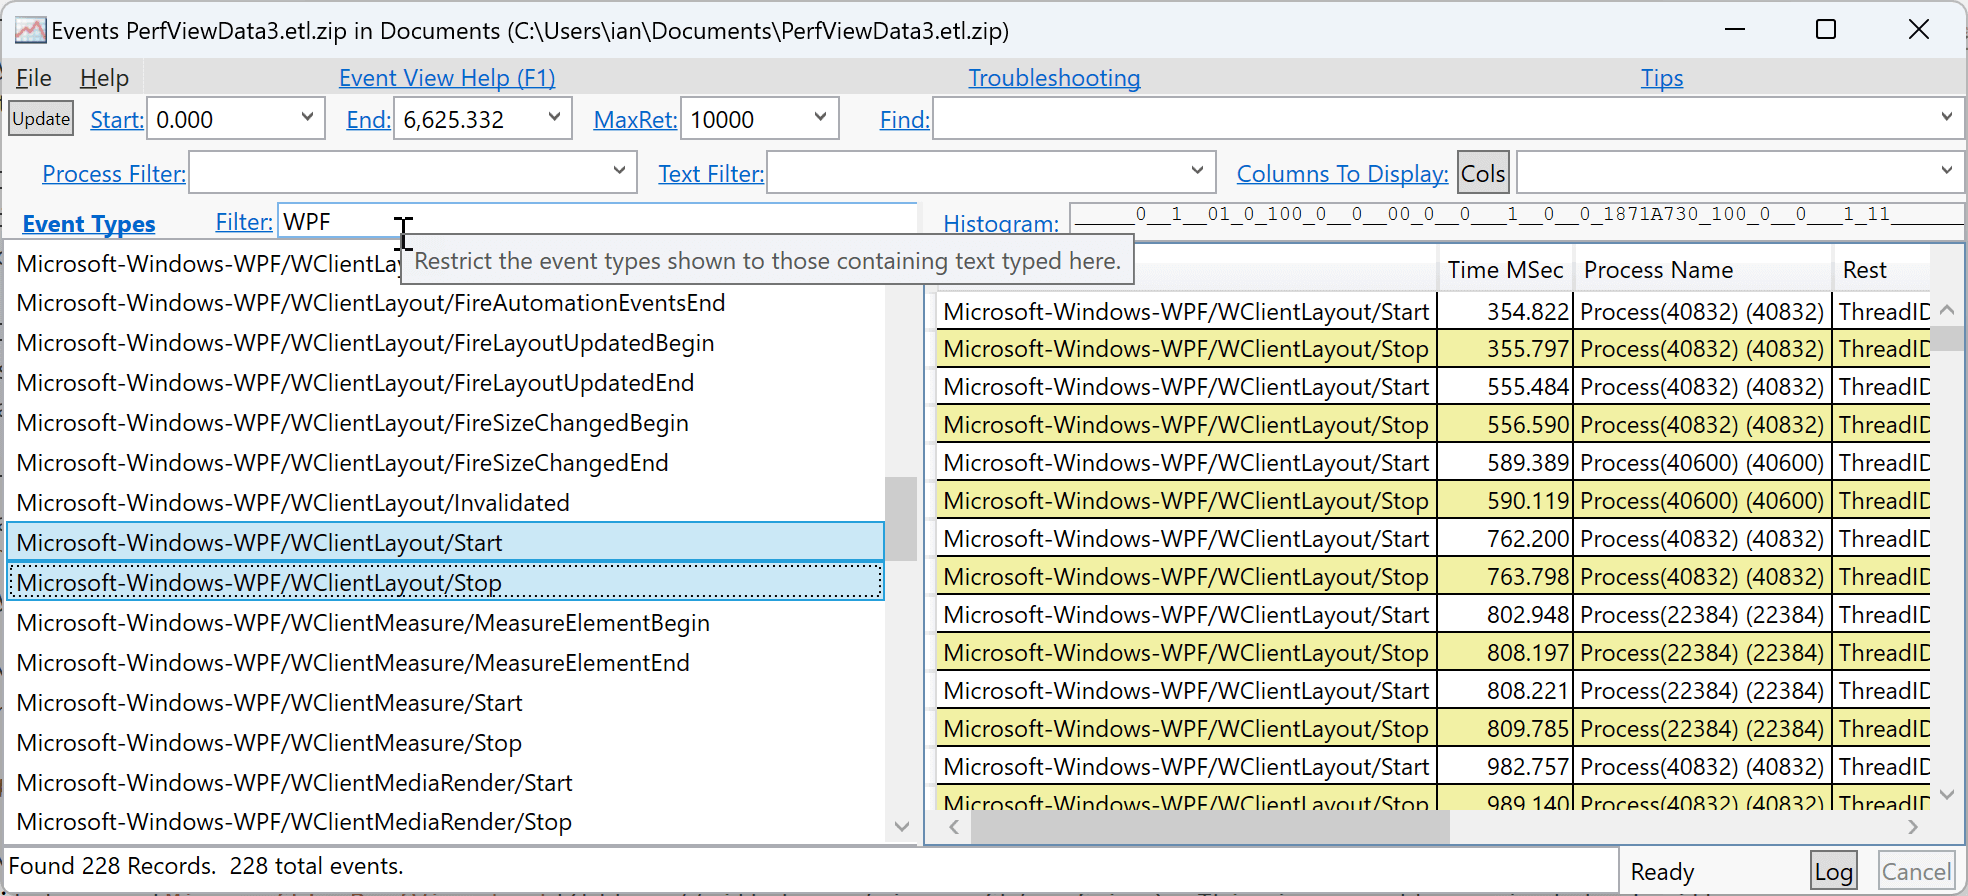
PerfView shows a list on the left indicating every ETW event type it collected during the session. You can use the Filter textbox to filter this down to just those from WPF, or you can be more selective and choose, say, just layout-related events. When you select event types from the list on the left and then press Enter, PerfView shows all events of the selected type in the list on the right. (And at that point we've moved onto the topic of how to interpret such events, but that's a topic for another time.)
There are many other things you can do with PerfView, but this is not a post about PerfView. I just wanted to show how to get up and running with ETW on WPF.