Analysing WPF Performance Using ETW and PerfView


We recently carried out a performance analysis of a WPF application for which users were experiencing some performance issues. By analysing ETW data produced by the application in PerfView we were able to identify visual tree complexity and overpainting as the main performance culprits.
This post describes the approach we employed to extract these insights from the ETW data produced by the application.
If you want to understand how to capture ETW data produced by a WPF application, you should read my colleague Ian's blog post.
Background
The application in question had many tabs, and multiple levels in the tab hierarchy. The user feedback we had to go on was that clicking between tabs at the deepest level in certain branches of the tab tree was a bit slow. It wasn't painfully slow, but noticeable enough to be annoying.

The first step in figuring this out was to collect some trace data for analysis. WPF is natively instrumented to provide Event Tracing for Windows (ETW) data, and PerfView is a performance analysis tool that is capable of consuming ETW data. We used PerfView to configure ETW to collect all trace information that WPF can supply.
It's worth noting that configuring ETW in this way can have a distorting effect on the application's performance. ETW can produce huge volumes of trace data, and the work required to generate this data can slow the application down. However, it's worth tolerating this at this initial stage in the investigation – we want as much information as possible to help identify slow candidate areas for further investigation.
Identifying candidate areas for further investigation
The general strategy in a performance investigation like this is to start from user feedback and gradually hone in on a specific slow part of the application, then work to understand that part in detail, which should reveal areas for improvement.
The sheer quantity of information that ETW produces makes manually pinpointing events of interest challenging. We needed a means to easily pick out these events. To achieve this we added a small bit of instrumentation to the application to generate our own custom ETW events. For the user-identified slow tabs, a SetTab.Start event would be triggered when a tab was clicked, and SetTab.Stop when the tab's contents finished loading on the page.
The ability to pinpoint events of interest would enable two things. First, it would allow us to identify time ranges (as we'll see); given a time range, we could use PerfView to filter down to only events within that time range, which would allow us to see in detail what the application was doing in that period. Second, it would allow us to identify the “slowest of the slow” tabs – the prime candidate for further investigation.
At this stage we had everything in place. Next we needed to generate some data.
To generate trace data we manually clicked through the identified slow tabs – just like a user would do. However it's important to remember that first run performance characteristics in a .NET application are often different to later runs due to Just in Time (JIT) compilation. This application made use of Ahead of Time (AoT) compilation, meaning users never experienced the first-run performance hit from JIT compilation. But since we were running the application locally in debug mode, we would experience the JIT performance hit, and as a result the trace data generated would not be representative of the conditions experienced by the user. To get around this we simply clicked through the tabs in question once (to get the JITting out the way), waited for about 10 seconds, then clicked through them a second time.
Now we had data in PerfView, the next thing to do was to filter out the custom SetTab.Start and SetTab.Stop events generated from the first round of clicking through the tabs – the ones that involved JITting. To do that we first filtered all the ETW events to show only our custom events, which is done by selecting the relevant events and hitting Enter. After doing that we saw something like this in PerfView.
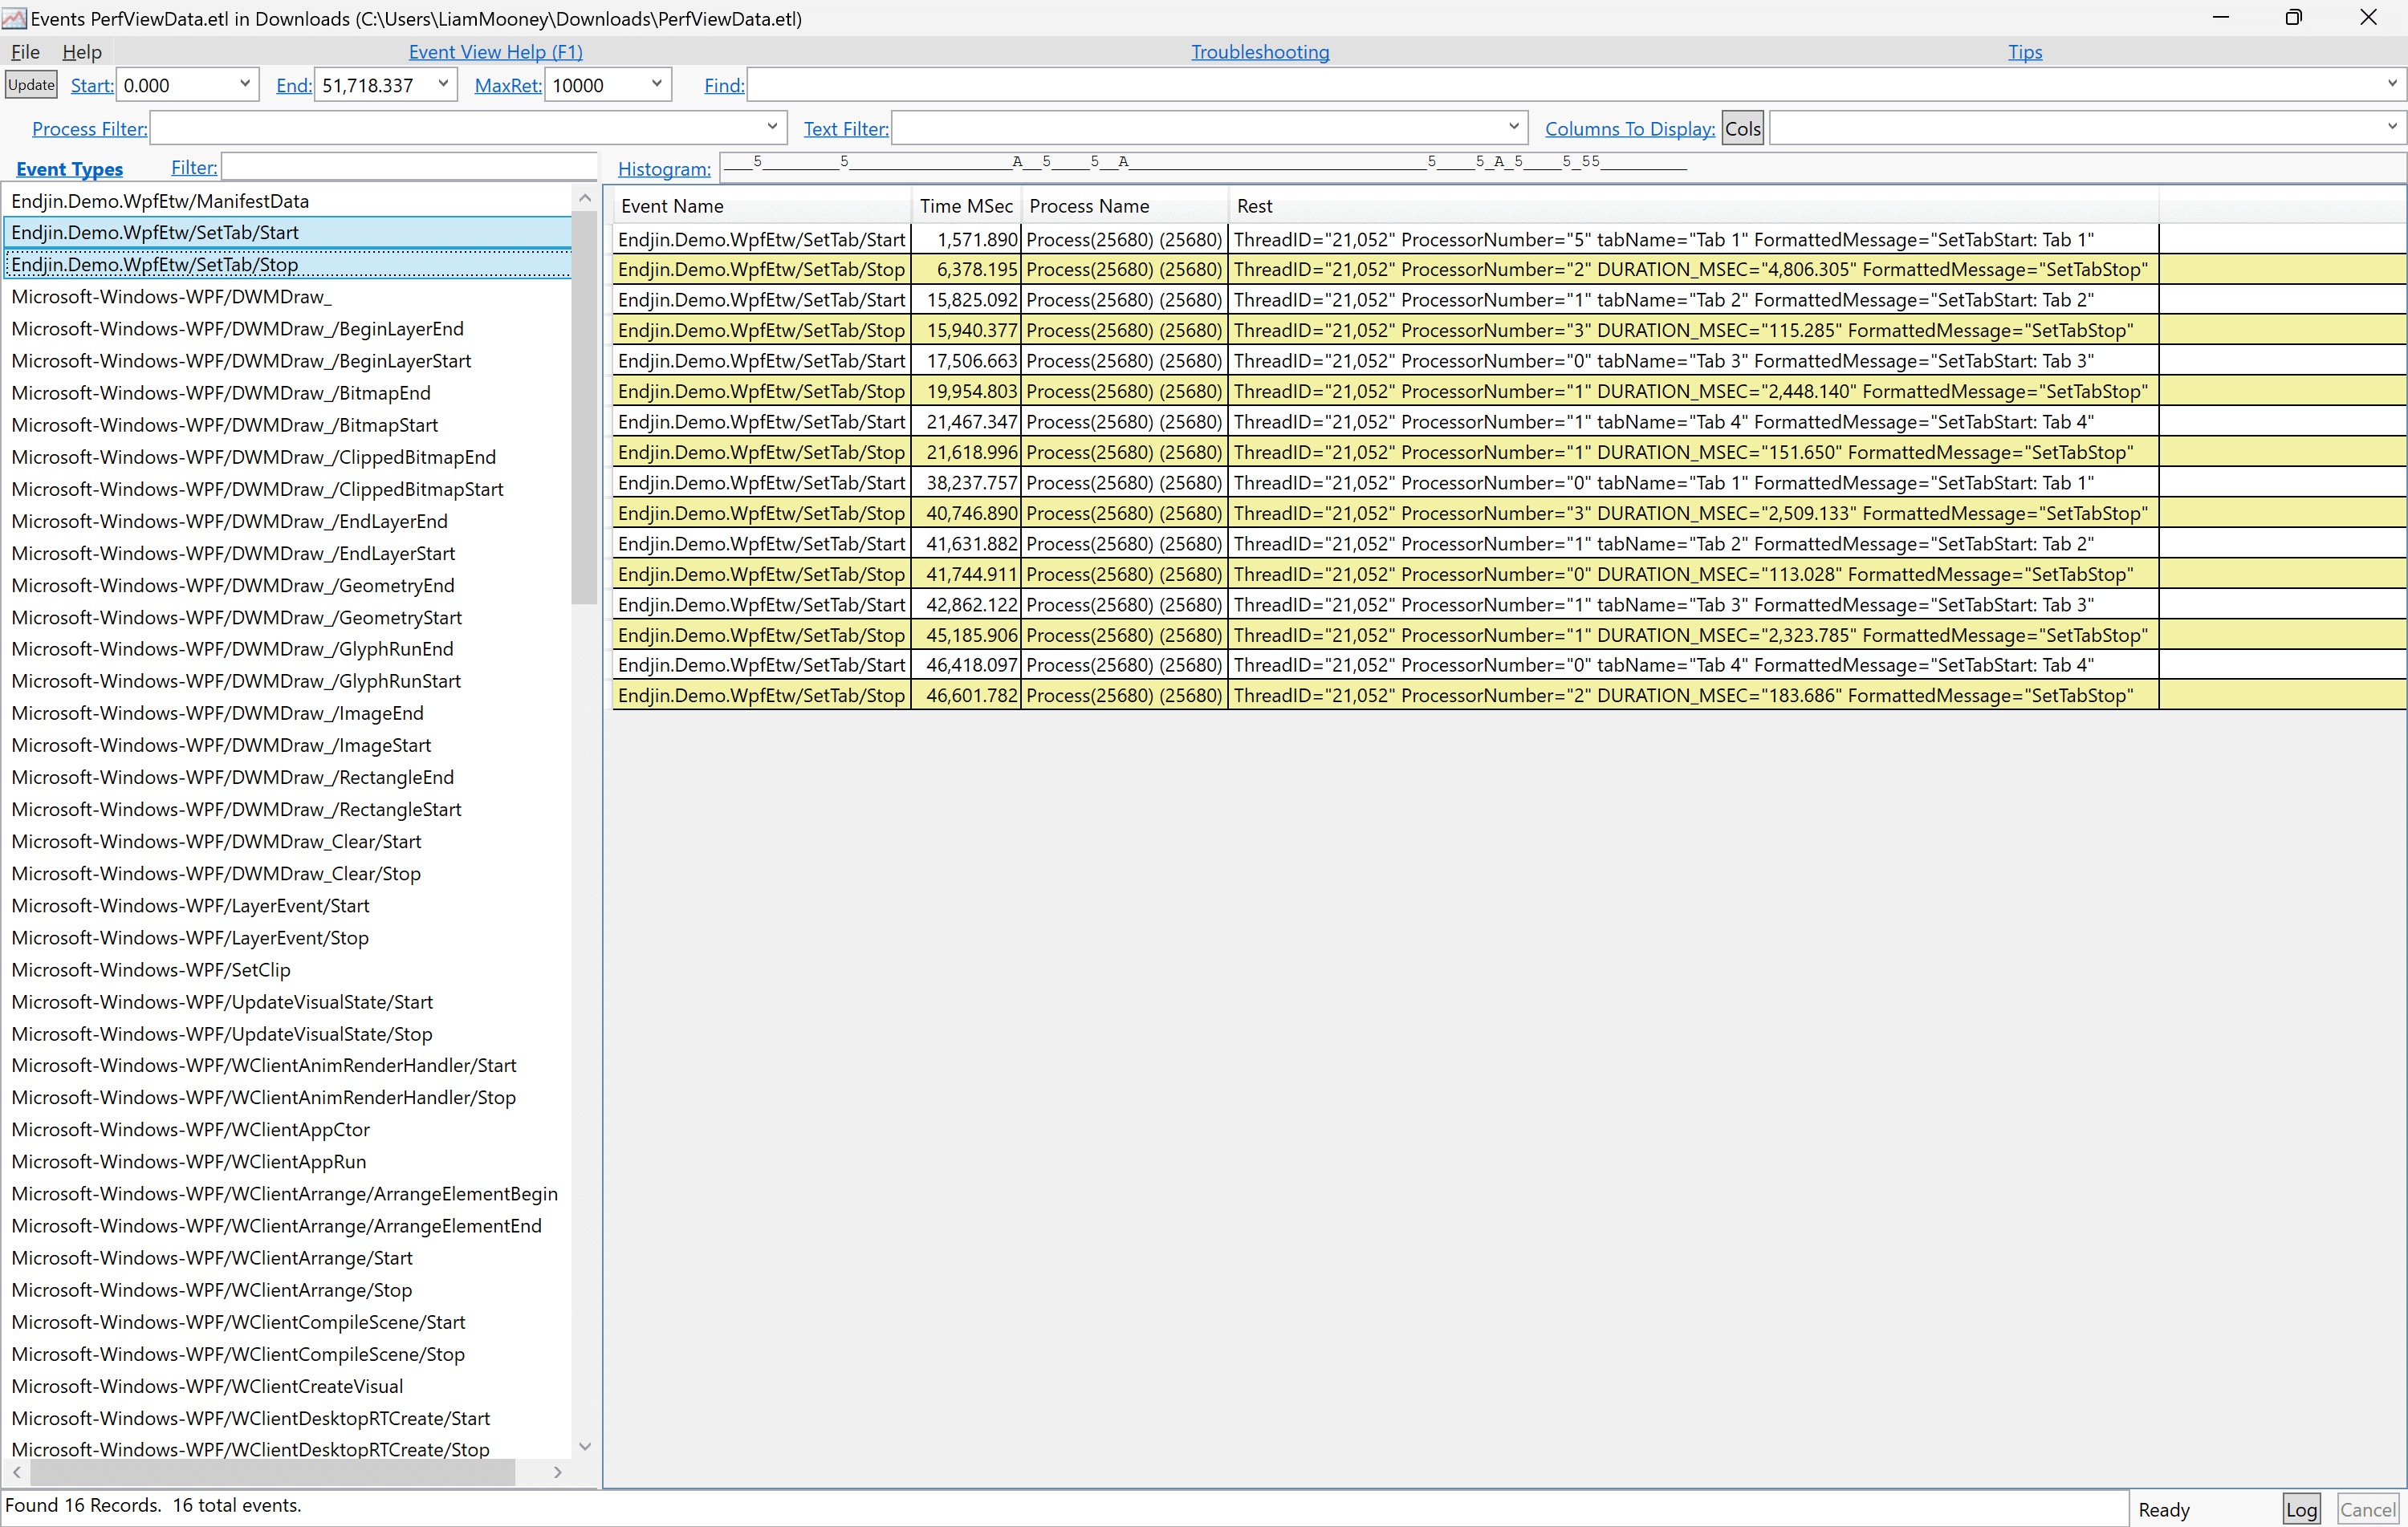
At this stage we could have eye-balled the resulting table of events to figure out which ones belonged to the second round of tab clicks, but to make our lives easier, and to allow for more sophisticated analysis, we decided to load the data into a Polyglot notebook. We used the Tx library to process the .etl files, and the Plotly.NET graphing library to produce a chart like this:

This shows all of the SetTab.Start events on a timeline, which makes it very easy to see the first 4 tab clicks followed by the (roughly) 10 second pause in which we did nothing before clicking through the same four tabs. After filtering down to just the events after the 10 second pause, we selected the pair of start/stop events with the greatest amount of time in between - identifying the slowest of the tabs.
Now we had identified the prime candidate for further investigation, we were in a position to look at what the application was doing to produce this slow behaviour.
Investigating the prime candidate
To see what the application was doing during the period of time between clicking the slowest tab and it rendering on the page we needed PerfView to show us all WPF telemetry generated in that period.
To achieve this time-based filtering you could note down the time from the pair of events identified and manually enter them into the Set Range filter. An easier way is to click the two cells under the Time column for the events corresponding to the start and end times of interest, then hit Alt-R (this adds the values into the Set Range filter automatically). Then, to make PerfView show all WPF events in this time period, we typed "WPF" in the filter field above the Event Type list, clicked the Event Type list and hit Ctrl-A to select all events, then hit Enter. As a result we saw something like this.
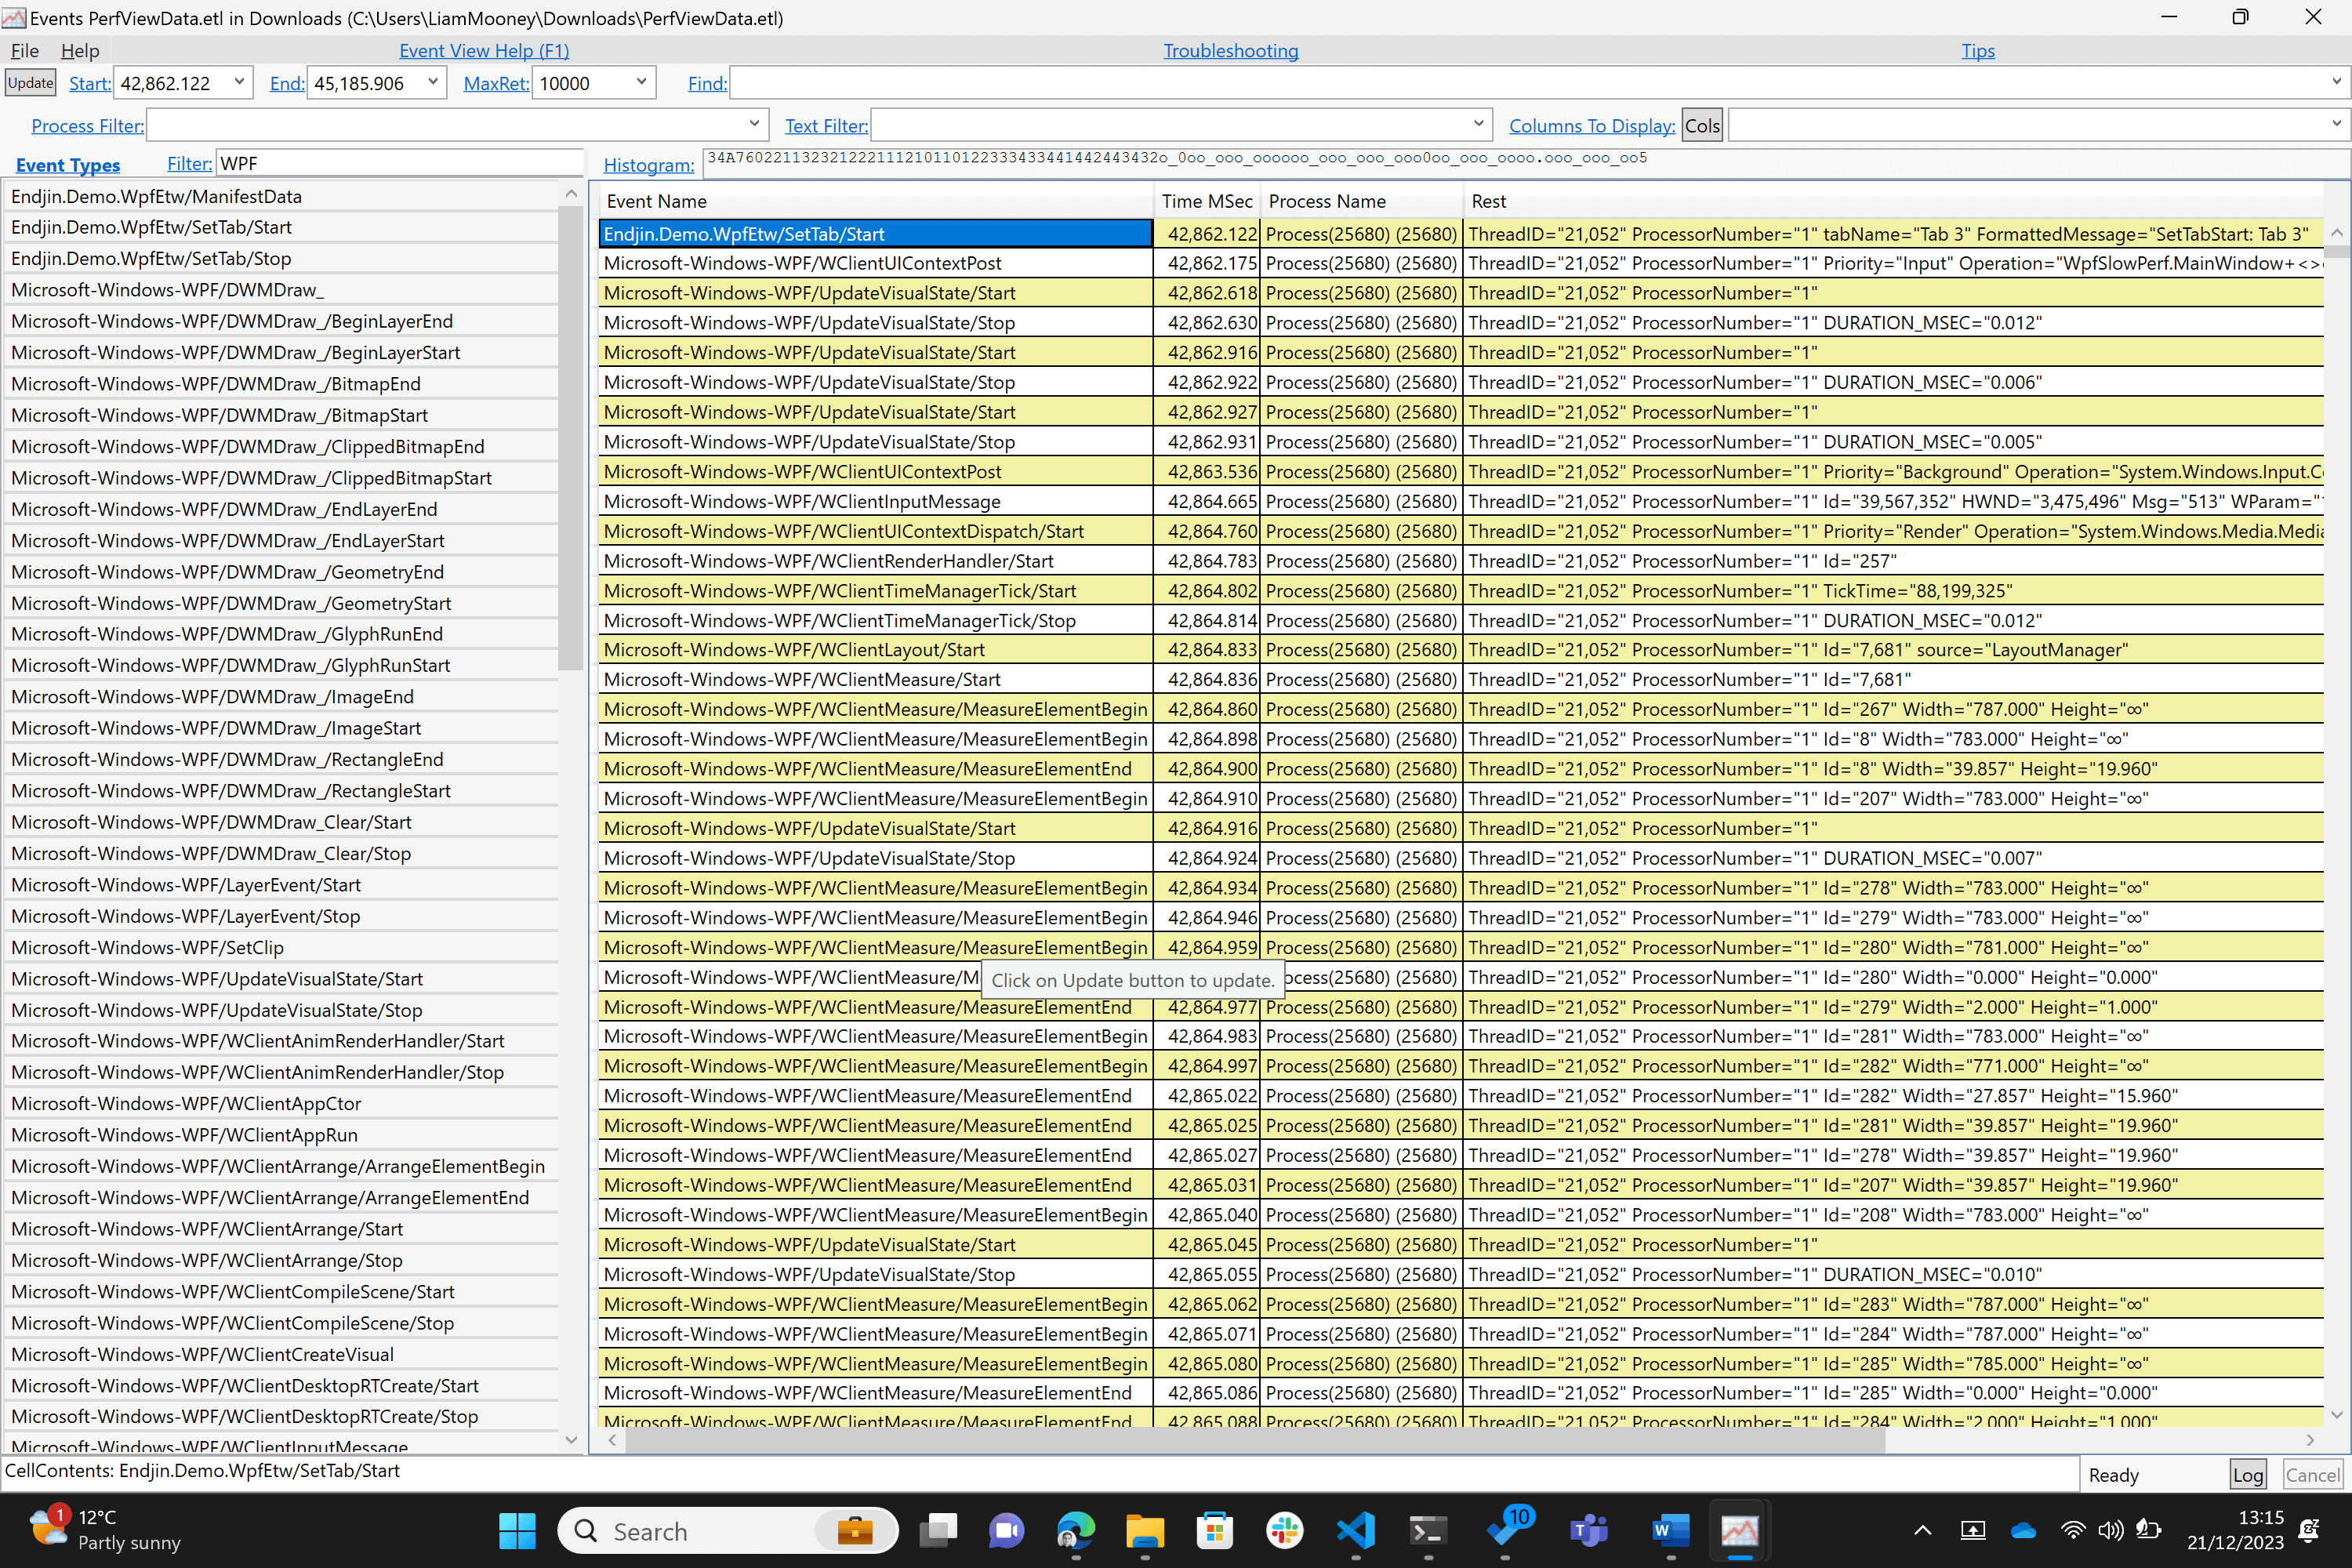
In our case this did not show all events within the specified time period since PerfView limits results to 10,000 by default to avoid consuming too many resources. If you want to increase the limit to show more events you can modify the value in the MaxRet field at the top of the window.

The next stage of the process is quite tedious. We have to scan through the table of events to get an idea of what's happening. The page PgUp/PgDown keys are useful here. Whilst doing this we were looking for two things: changes in the mix of event types, which can indicate that a new phase of the work is starting; and sharp changes in timestamps, which point to slowness.
When doing this we saw multiple pages of events related to certain parts of the rendering process. This in itself is not indicative of slow behaviour - if WPF is producing thousands of notifications per second, that suggests it's probably getting through work quite fast. On the other hand, if it's producing relatively few events per unit of time, that suggests it's doing things slowly - hence why we look out for sharp changes in timestamps between events.
We saw that the first few pages contained lots of WClientPropParentCheck and WClientResourceFind events, which are typical of template loading. Later we saw lots of WClientMeasure events, indicating that WPF had started the layout phase. We could see from the timestamps of the events that the layout phase started ~70ms after the start of the template loading phase, which suggested template loading may have been a performance issue.
A good rule of thumb in application development is that users should receive a response to their input within 100ms, after this threshold the user will feel a disconnect between their input and the resulting response - the app with feel sluggish. So, when we realised that a single task in the entire process for producing a response consumed 70% of our time budget, we noted this as a potentially productive target for performance tuning.
The large number of WClientMeasure events suggested the application was doing a lot of layout-related work, which made us wonder whether the visual tree had too many elements in it. This prompted us to run the application in the debugger to get a picture of the visual tree.
In the debugger we inspected the visual tree from the element representing the selected page downwards. We saw a large number of elements in the visual tree for this specific page, most of which were not visible on the screen. This meant that the application was asking WPF to perform unnecessary work in managing these elements. Moreover, some of these elements had a visibility of Visible, meaning WPF was painting them on the screen but was later painting over them with other elements. Again, WPF was doing unnecessary work.
WPF can't optimize cases of overpainting automatically. The reason is that elements are allowed to have partially or completely transparent regions - it can be used as a technique to achieve certain visual effects. So WPF just does what you tell it. If you're not deliberately using this as a technique to produce visual effects, or some elements completely obscure others, you should tell WPF not to bother drawing the overpainted elements by making them invisible.
At this point we had a couple of hypotheses about the cause of the identified slowness: visual tree complexity and overpainting. Next we wanted to perform some experiments to test the hypotheses.
Testing Hypotheses
For visual tree complexity we disabled some functionality, confirmed that element count had gone down, then re-measured time spent doing template loading and layout work. The results verified that this was lower than before; supporting the visual tree complexity hypothesis.
For the overpainting hypothesis we identified some elements that were completely obscuring others and set their visibility property to hidden to tell WPF not to draw them. On re-measuring we found that template loading and layout times were unaffected, but the WPF events associated with rendering - WClientUceRender - revealed lower rendering time. These results supported the overpainting hypothesis
Conclusion
By using PerfView to consume ETW event data from the WPF application, and by following the scientific method's cycle of measure, hypothesize, experiment, measure we were able to hone-in on the cause of the performance issues. This revealed an overly complex visual tree and overpainting as the main culprits responsible for poor performance.