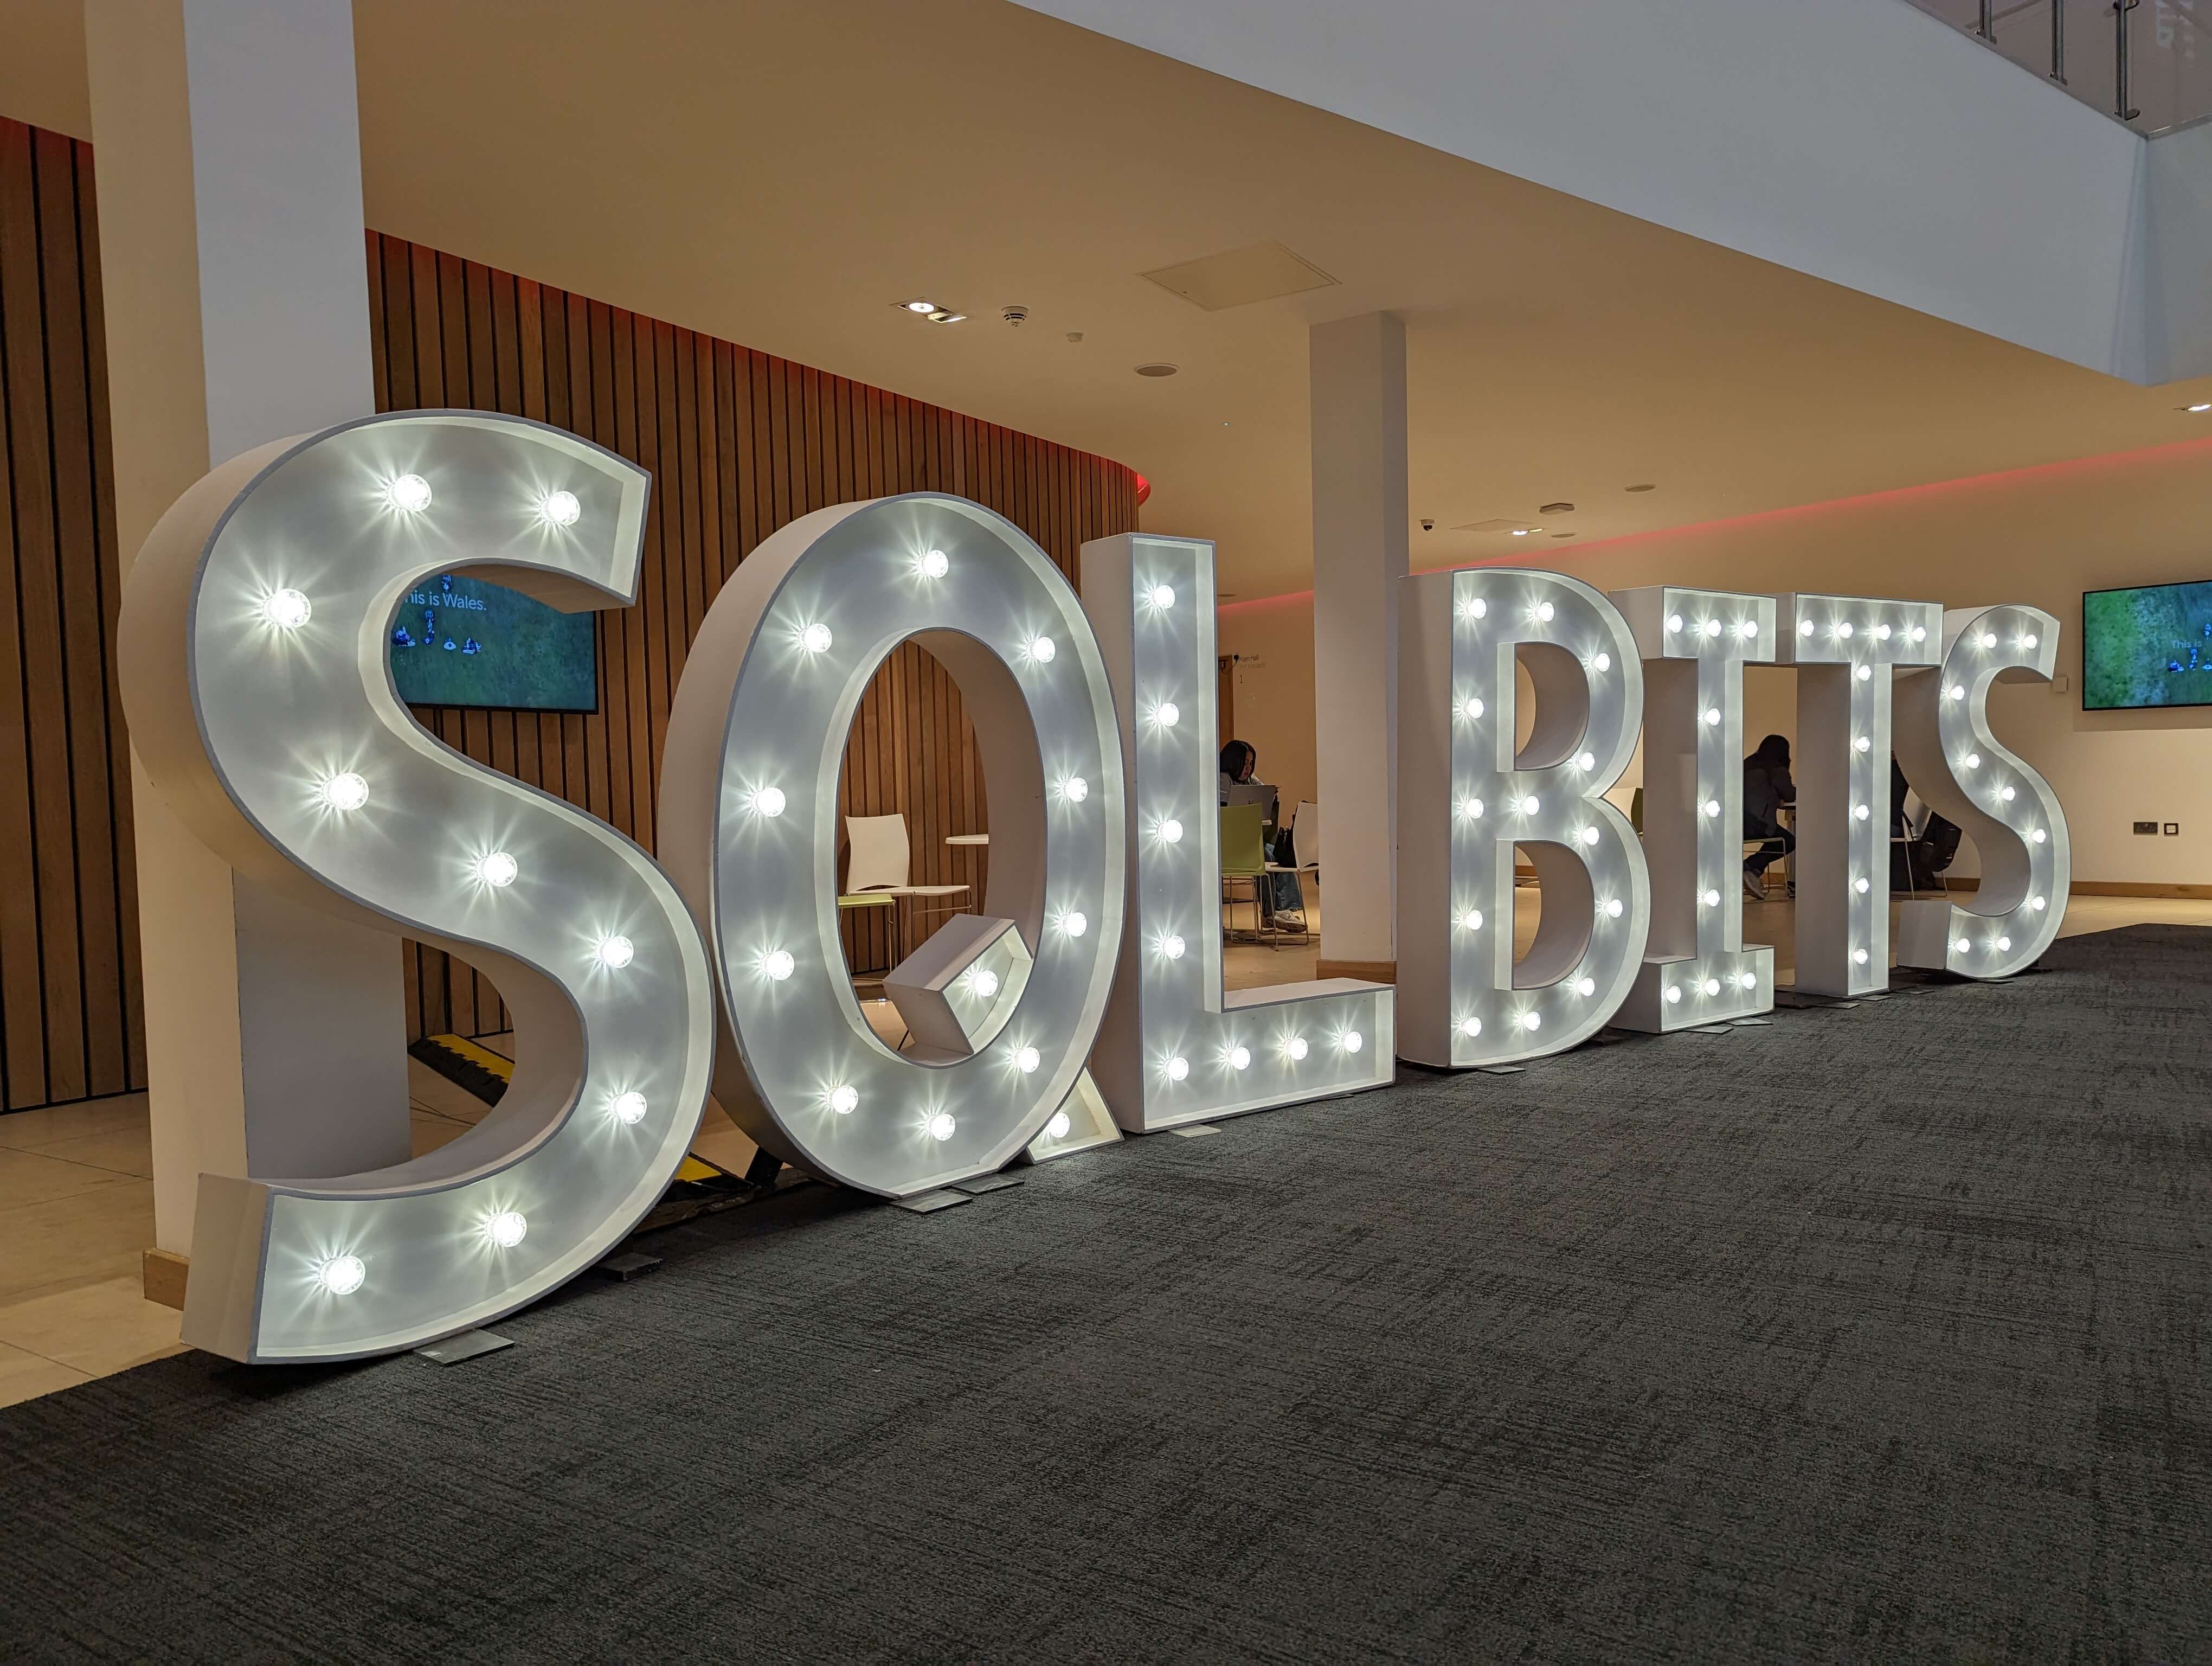
SQLbits 2023 - The Best Bits


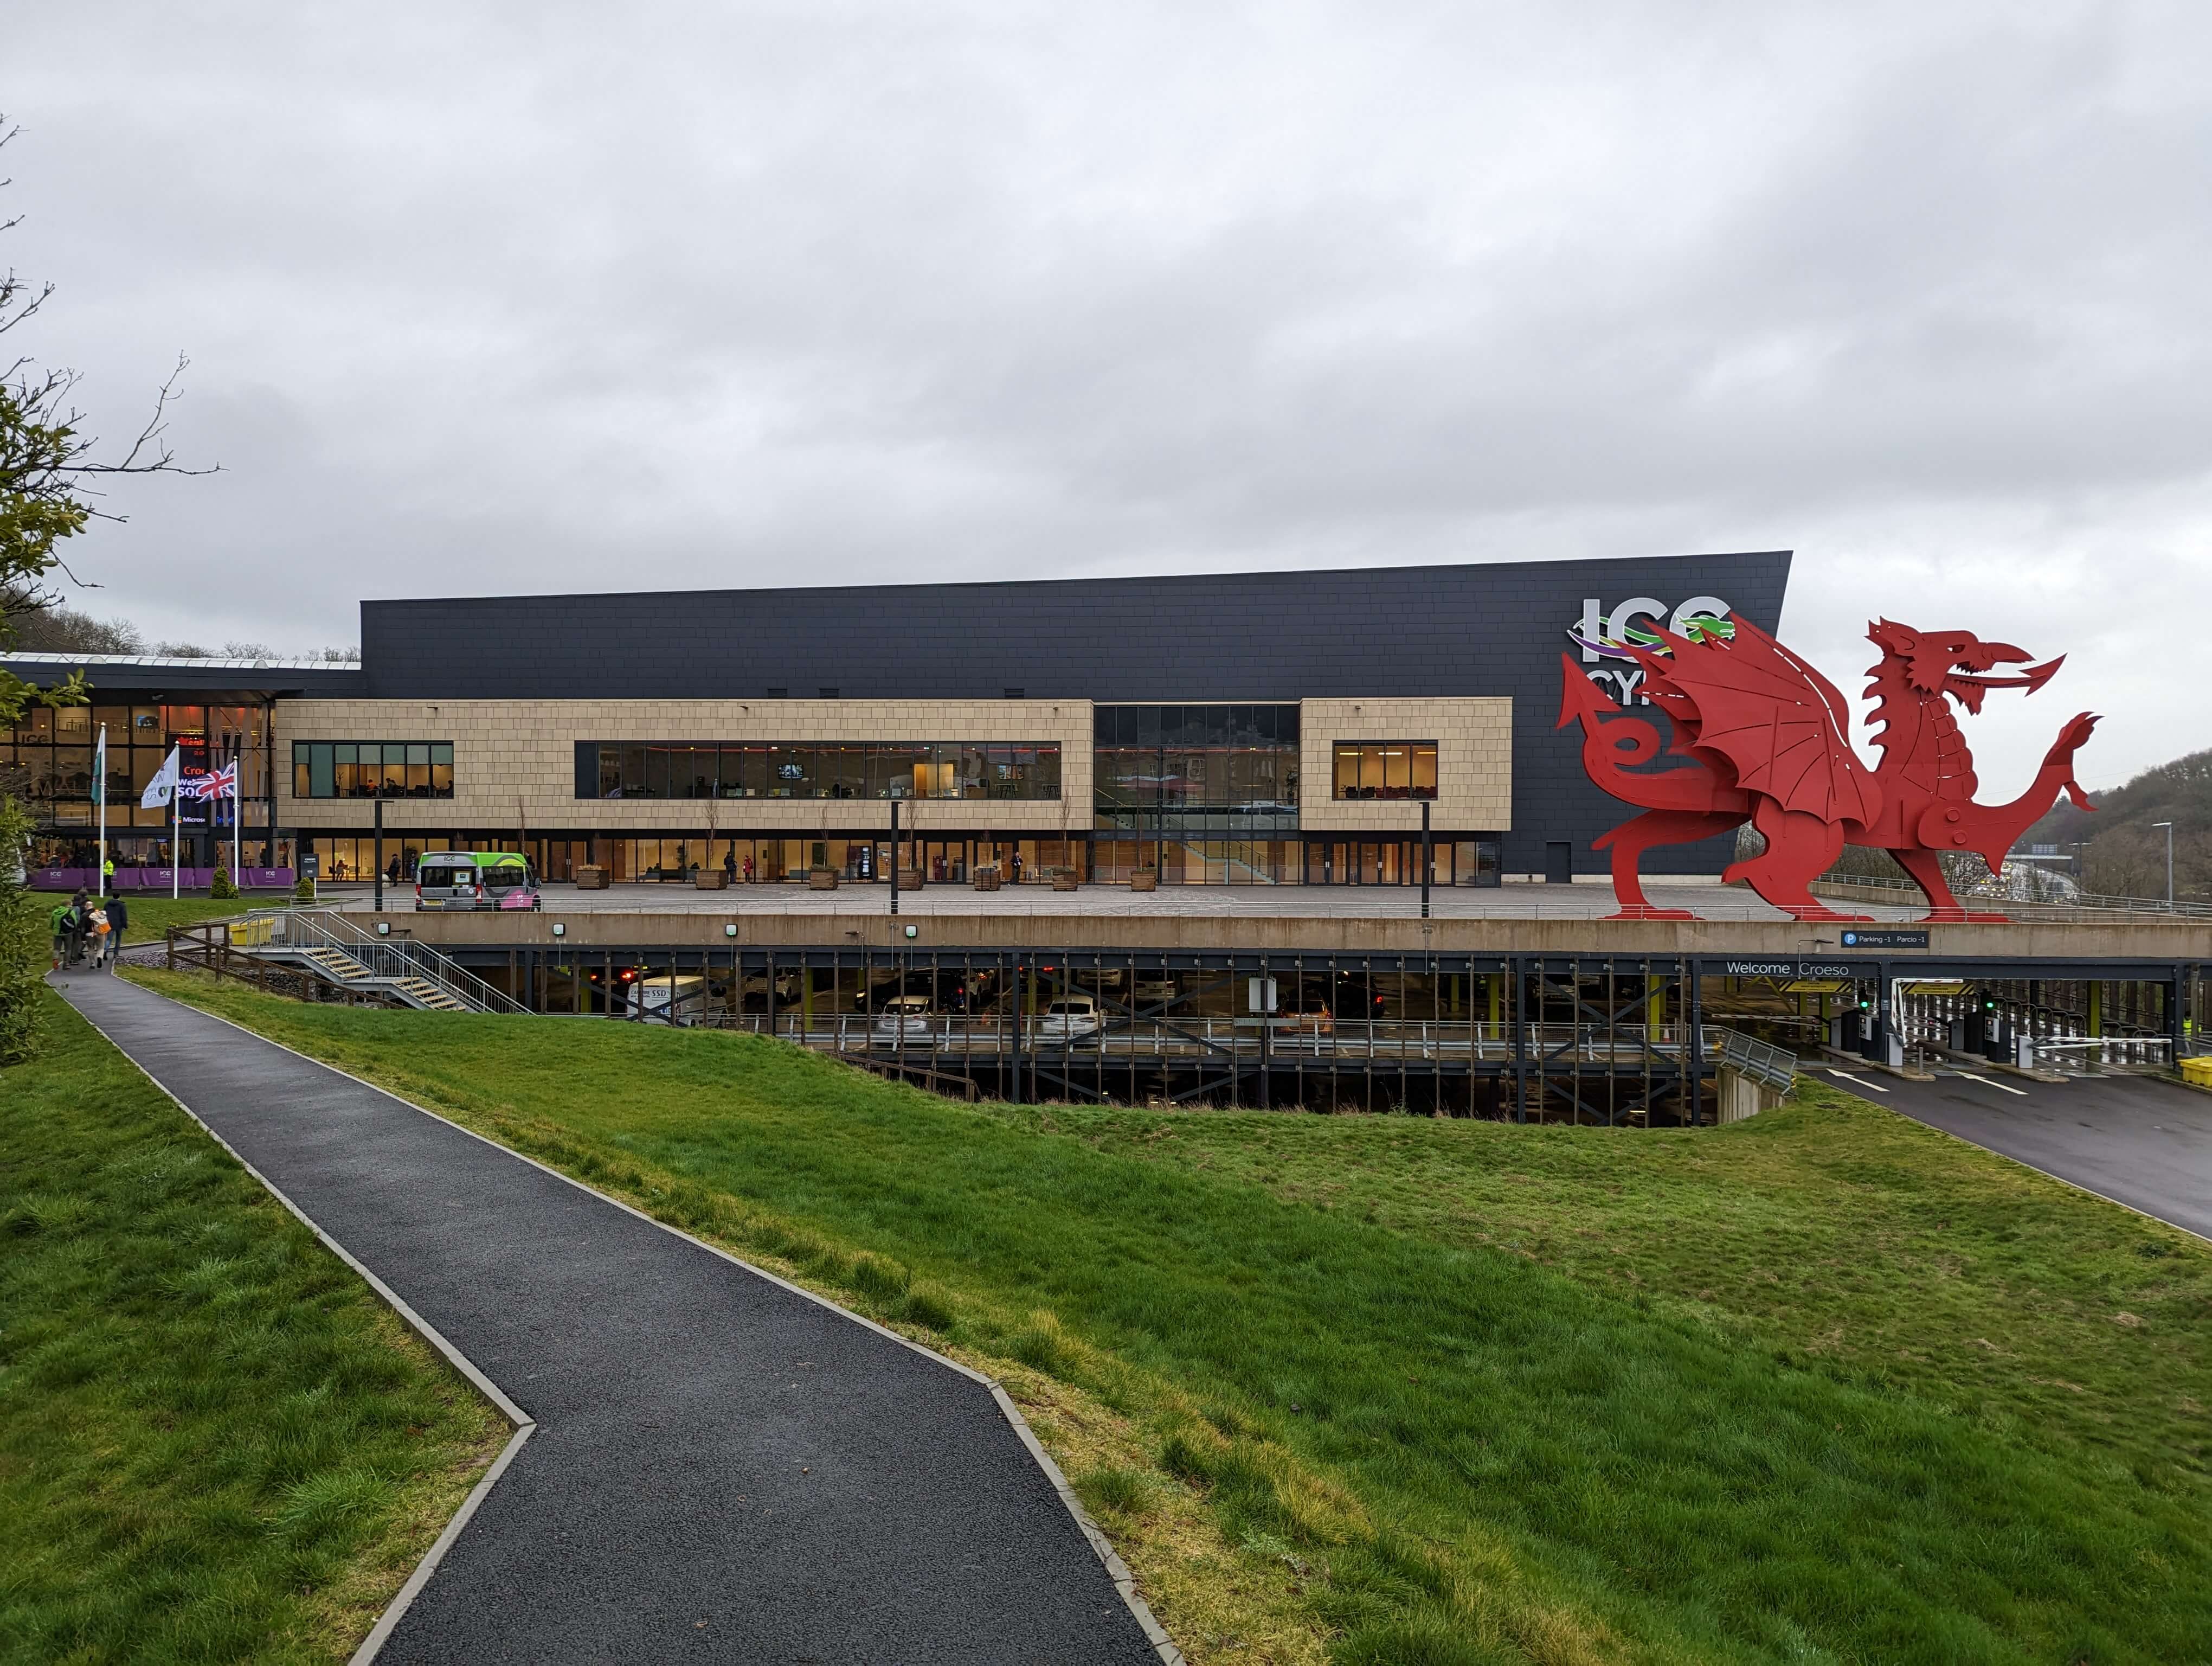
For the second year in a row I attended SQLbits - the largest expert led data conference in Europe. This time the journey took me from Scotland to the International Conference Centre in Newport, Wales.
The theme this year was Dungeons and Dragons gaming, which created a nice link to the dragon on the national flag of Wales. It was great to see this theme being embraced throughout the conference by the vendors, in the various sessions and in the after party on the Friday evening.

Compared to last year (when we were just emerging from lock down), it felt like there were twice as many people in attendance. There was a real buzz in the main exhibition space and a few new exhibitors to meet too!

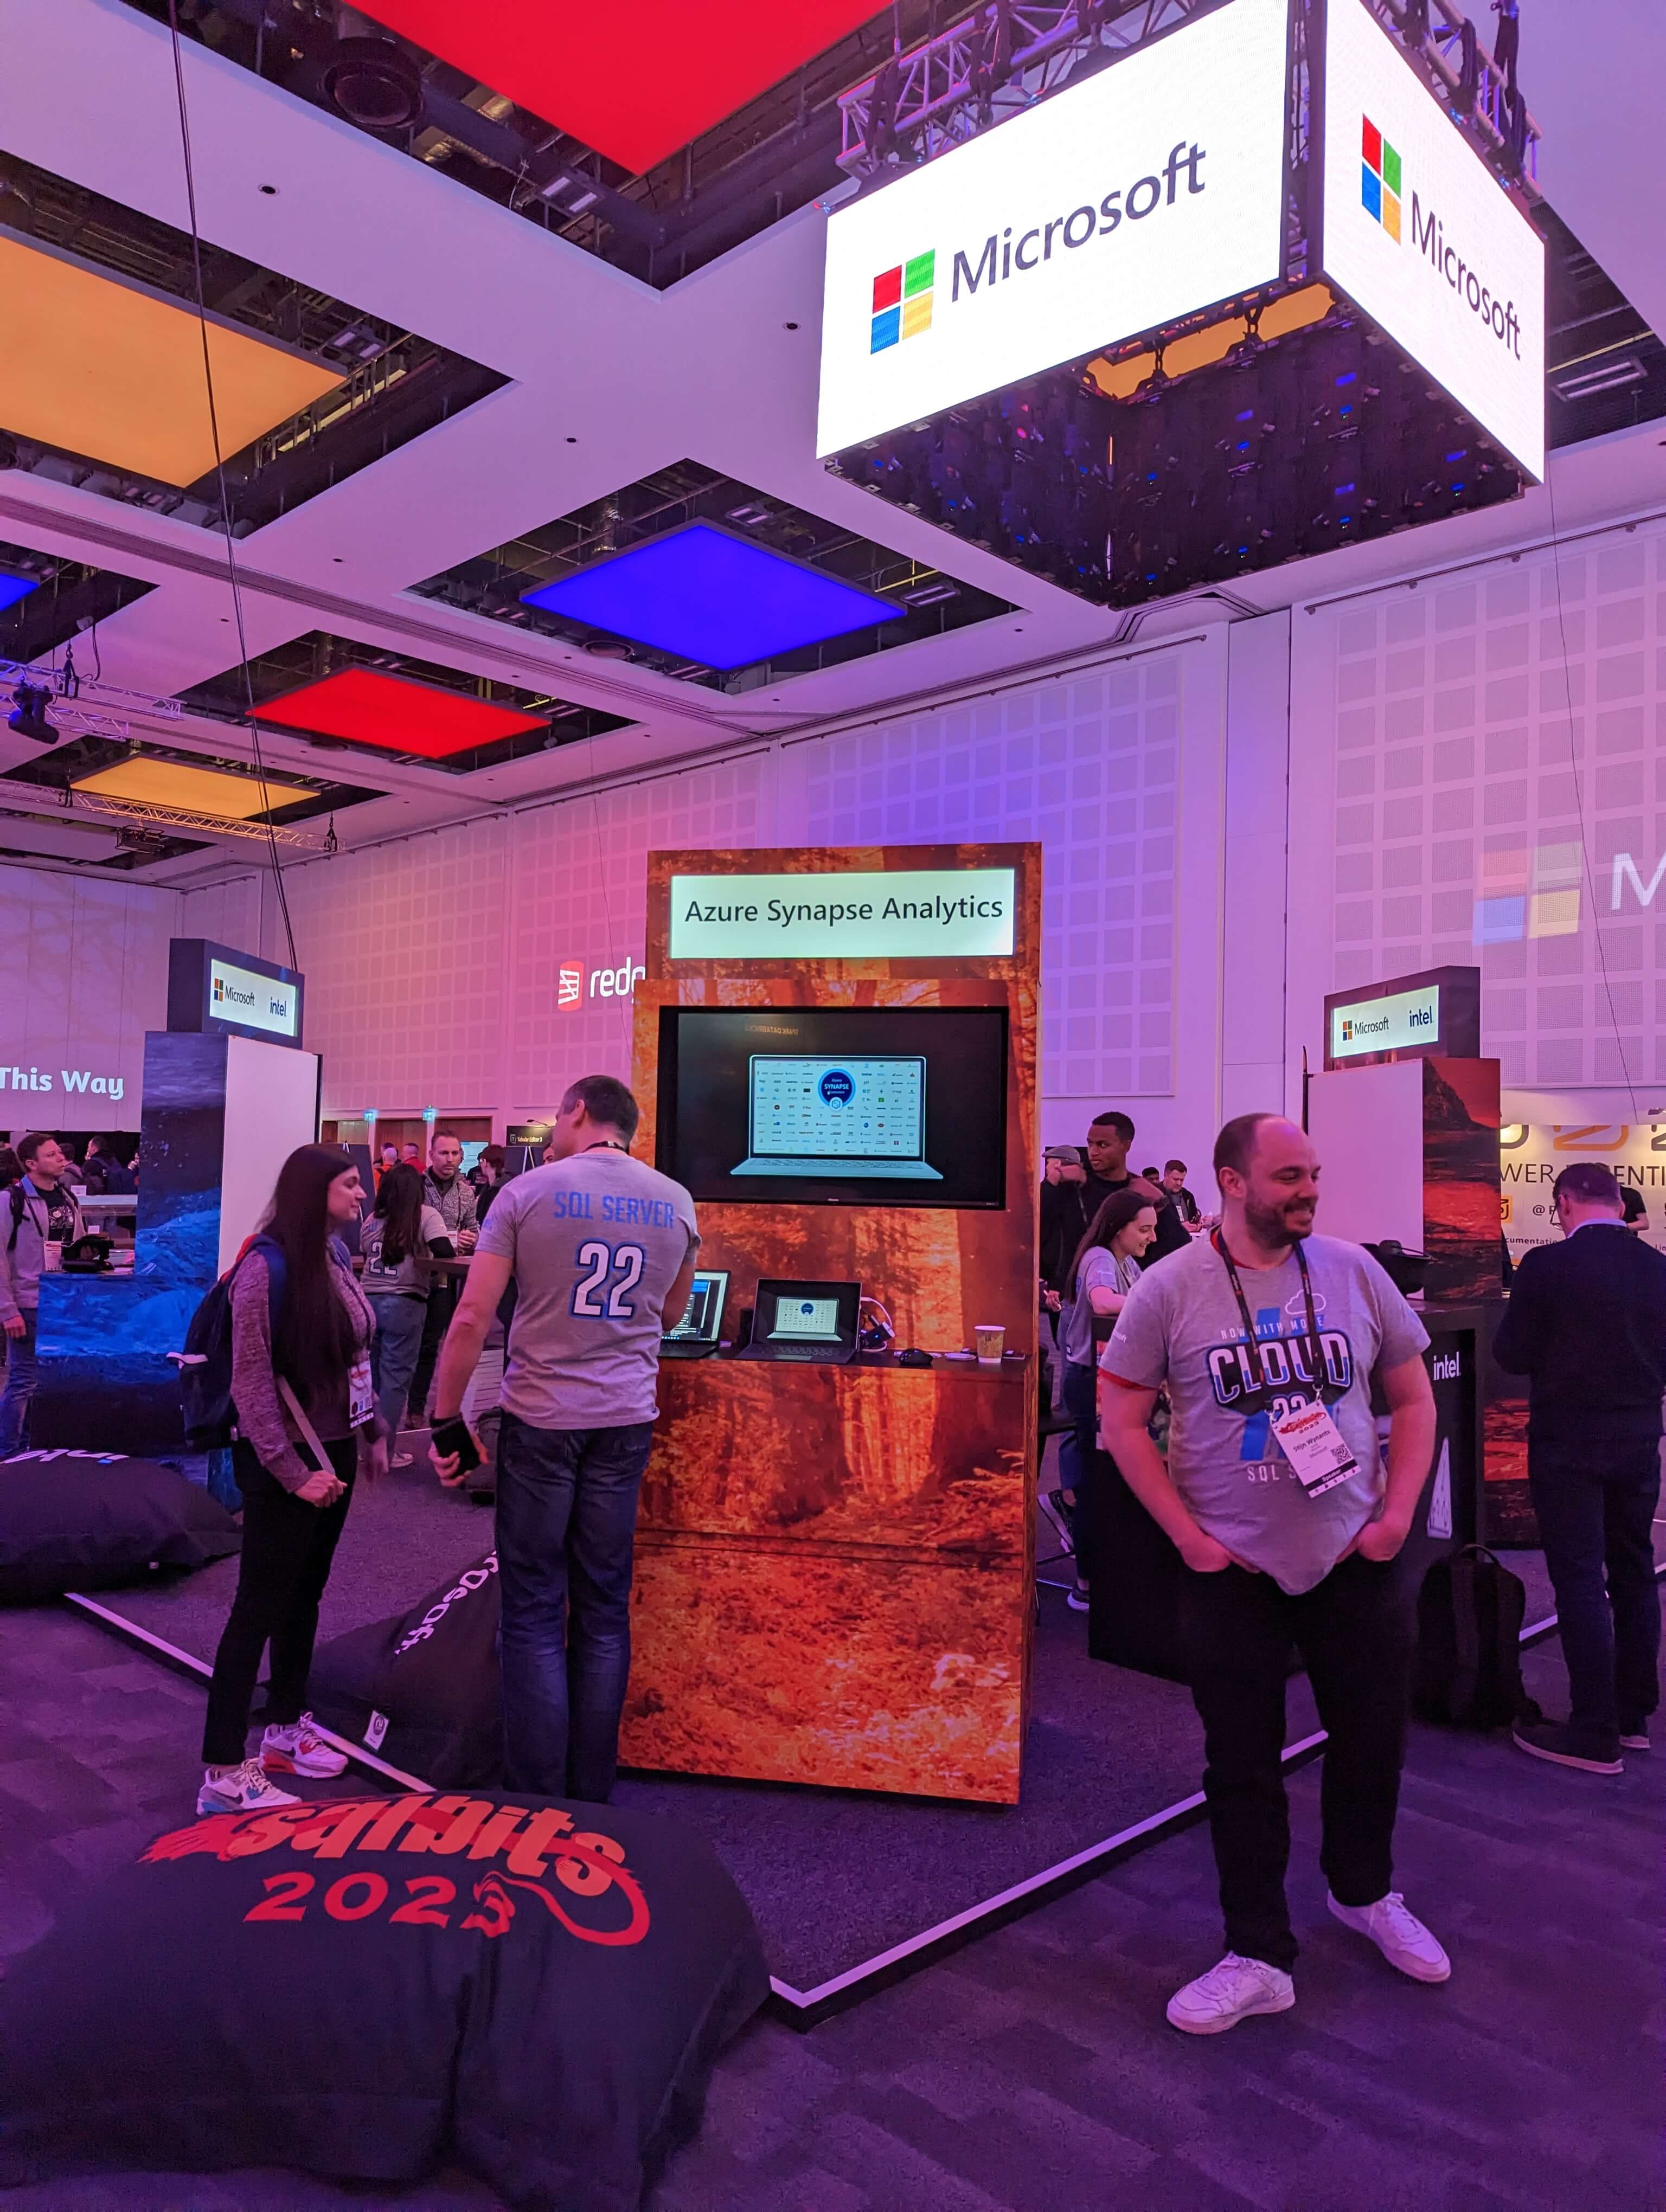
Microsoft had a large central stand manned by product teams for SQL Server, Azure Synapse Analytics and Power BI. It was nice to meet them face to face!
This blog captures the highlights from the sessions I attended.
Keynote
We were reminded that SQL Server is the most deployed database in the world - due to its support for on premise and all cloud providers. That this level of adoption is largely down to the strength of the community.
The keynote fully embraced the Dungeons and Dragons theme.

There were some funny moments, but a lot of exciting announcements too:
- The new Data API Builder which enables modern REST and GraphQL API to be built over Azure SQL Databases.
- How Azure Arc can be used to generate an inventory of all of you SQL databases, providing insights to help you govern and secure your entire estate.
- We saw a demo of a new public preview feature of the Managed Instance Link Feature enabling fail over and fail back of a SQL Server 2022 and Azure SQL Managed Instance.
- Developer productivity continues to be a focus through new tools such as sqlcmd and active development of Azure Data Studio

How to create a high performance data team
I had the privilege of delivering a talk this year to a packed room on the topic of creating high performance data teams. It was really interesting trying to compress 30 years of experience working in the tech sector into 20 minutes.

I'm going to record the talk later this week, so look out for this in the talks area of the endjin web site!
Automated Machine Learning on Azure
Dr Gavita Regunath, a Women in Data Science ambassador, compared two Automated Machine Learning (AutoML) platforms that are available on Azure: Azure Machine Learning Service and Azure Databricks.
Machine learning is on the rise, a recent survey found that 84% of CEOs are making AI and ML a strategic priority. However, whilst there is a lot of ambition, many organisations are struggling. Only 50% have successfully adopted AI.
This where AutoML can help. Gavita made the case for AutoML on the basis of it being able to streamline the process by removing some of the heavy lifting and repetitive manual tasks that are often involved in getting a Machine Learning model into production. By automating tedious tasks and increasing efficiency you could enable more rapid innovation.
She provided an excellent side by side demonstration of the two platforms by training models based on the same training data set - a binary classification problem concerned with predicting the propensity of a customer to respond to marketing campaign.
What occurred to me is that AutoML cannot be treated like a black box, nor something you can throw raw data at and expect to get a useful outcome from. You still need put in effort to prepare the data and perform feature engineering (the secret sauce that elevates the performance of ML models) and you also need a good understanding of the machine learning lifecycle to enable you to be able to choose appropriate ML models and to evaluate the models.
A couple of interesting capabilities jumped out in the comparison:
- I wasn't aware of the feature store in Databricks and will investigate this further
- Azure Machine Learning Service has a broader set of models available to apply in the AutoML process, including Deep Learning
- Azure Machine Learning provides a rich set of interactive tools to support model explanations - helping you to understand the key features that are driving the model
Thanks for the side by side comparison Gavita, I've definitely been inspired to experiment with AutoML.
Future of Version Control for Power BI
Mathias Thierbach (representing the community) and Gabi Muenster (representing Microsoft) revealed a significant step forward for those seeking a more "ProDev" experience around the development of Power BI models.
The issue is that the current language (TMSL) is machine readable, not human readable. Difficult to co-author and to merge changes. Therefore it does not provide the foundations that ProDevs need.
Mathias has worked with the Power BI product team at Microsoft to develop a new syntax called TMDL: Tabular Model Definition Language. This will be a native solution fully supported by Microsoft.
TMDL closer to YAML format - indentation instead of parenthesis to create structure. So much easier for humans to read. Furthermore, the model is broken down into folder structure with lots of files (as opposed to the current single large file adopted by TMSL). Making it much easier to navigate the model, edit and co-author.
Mathias demonstrated TMDL in action:
- Generating TMDL using Power BI Tools utility:
pbi-tools convert [source *.bim file] [output folder for TMDL] - Editing TMDL using a VS Code extension has is available on GitHub as a community project. At the moment this supports:
- Colour coding
- Collapse expand support
- Illustrating how TMDL captures M and DAX code with no escaping, enabling operations such as copy and paste which is not easy with TMSL.
- Automatically deploying changes to the model, by using a Git enabled repository and Azure DevOps pipeline to deploy changes into target Power BI workspace (dev, test and prod instances) when a pull request is approved. This includes option to triggers refresh of the model (auto mode available) and took a couple of minutes end to end.
- First class support for descriptions of objects to support governance and good practice around documentation of models.
This is just a start a lot of new features coming! Microsoft are looking for community feedback to drive this project forward. I'd definitely encourage you to check this out if you are seeking to apply a CodeOps approach to Power BI model development.
Designing for Accessibility
I attended a few sessions on Power BI report design. The session that stood out for me was with Serena Samra, who is a Data & AI Cloud Solution Architect at Microsoft and specialises in Power BI and Data Visualisation. Serena used her background in bio-computing and her own experience being dyslexic to reinforce why it is critical to develop Power BI reports that are accessible.
Serena revealed that 1 in 5 people identify with having an accessibility need. I also know that there is a subset of those (1 in 12) who have Colour vision deficiency (colour blindness). By designing reports to be accessible you are not just helping the 20% who have an accessibility need, you are helping everyone! Furthermore, organisations are committing to WCAG 2.1 (Web Content Accessibility Guidelines) so it is better to design accessibility in now rather than having to rework reports in the future.
Serena made the case that it's a simple choice to start applying these principles, there are lots of tools to support you!
She then demonstrated accessibility in action through using accessibility tools, checklists and Power BI accessibility features. I picked up the following tips:
- Don't fall into the traps of using acronyms in your reports.
- Don't rely solely on colours to relay information, think about using data markers and line styles.
- There is a tension between accessibility and wider demands on report design. You often have to balance the two - for example to avoid information overload and clutter.
- ALT text - you can add dynamic context using DAX measures to help people who rely on this to get more information from the report.
- Tab order is controlled in the selection pane. This is important for people who rely on a keyboard rather than mouse to interact with Power BI.
- Microsoft have added new accessible themes to the Power BI palette.
- A checklist is a useful way to check if all accessibility options have been applied in Power BI - Serena implemented this as a Microsoft Form to make it more interactive.
- There are accessibility tools in Power BI service, such as high contrast modes to help people consume reports. It is worthwhile reviewing these to make sure visuals still render successfully in this mode.
My colleague Paul Waller is also passionate about this topic, for example he recently blogged about creating an accessible colour palette for Power BI and has range of other blogs related to building accessible, high impact Power BI reports.
Excellent session Serena!
Power Platform becoming increasingly capable
I attended a few sessions that focused on integration between Power BI and the wider Power Platform.
A team from Simpson Associates (Matthew Bean, Lee John and James Solan) had built a digital version of the game of dungeons and dragons using PowerApps and Power BI. The solution used GPT-3 APIs to produce machine generated text (plot, character stories / obituaries) and images (characters and monsters). It was interesting how they had iterated on the architecture to get the right level of responsiveness for players. This included putting all the resources in the same Azure region to reduce latency between different resources, use of views and indexing to optimise the database, materialising data in the model to avoid unnecessary re-calculation of slowly changing dimensions and designing the Power BI model to minimise the amount of work required in the DAX layer. It was amazing how feature rich the gaming experience was, augmented with the Power BI analytics across all games played.
Heidi Hasting ran a session remotely from her home in South Australia providing a demo of 5 integration patters for Power BI and wider Power Platform. It's interesting to see the wider variety of use cases that are now supported for no-code / low-code experiences. It was interesting that Heidi flagged some of the barriers to adoption being silo'd teams, e.g. if you have one team that does Power BI and another which does Power Apps and Power Automate and another that manages Teams, it can be challenging to get these types of solutions developed. Another key point with the Power Platform is that it doesn't mean engineering practices can be abandoned, e.g. thinking about lifecycle management and setting up DTAP "environments" to mange risk.
My colleague Mike Larah has recently published a blog 5 lessons learnt from using Power Automate giving some useful tips.

Azure Data Studio
Erin Stellato, Senior Program Manager, Microsoft is responsible for the "SQL experiences team", this means she looks after the future direction of Azure Data Studio.
This was a very interactive session where Erin was looking for direct feedback from the audience about their experience using Azure Data Studio. It was amazing to hear all of the positives being called out: notebooks, export to Excel, GitHub integration, intellisense, logging in experience, it opens in a few seconds, support for PostgresSQL, query history, extensions and runs on Mac.
We were given a tour of some of the newest features including "view by schema" as a more intuitive way to explore database objects, the query history extension and enhanced execution plans analytics which allow you to compare plans side by side.
Focusing on the why - Power BI User Journeys
Mara Pereira, Founder & Principal Power BI Architect at Data Pears, provided a challenge to all Power BI report builders - start with "Why?"!
By understanding why a user is asking for a report, you are going to end up with a more valuable outcome. Because you will reveal the goal that the report is seeking to achieve, for example: reducing costs, helping to win new customers, reducing risk etc. The challenge is often that report users will express their requirements by describing the solution, i.e. the what. So the trick is to dig into what is being asked for to uncover the underlying goal by asking "Why?".
We would absolutely agree that Power BI reports should:
- Have a clear link to the organisation's strategy and goals.
- Focus on the value the report is going to bring to the business by identifying one or more actionable insights that it will enable.
- Using techniques around report design, user journeys and accessibility to deliver actionable insights in the most effective way.
My colleague James Broome has a series of blogs that describe Endjin's Insight Discovery process and how it helps you to ask the right questions of the business, so that you can design a data platform that fully meets their needs.
No more data quality surprises!
Dave Ruijter, Solution Architect Data & Analytics and Microsoft MVP, provided an introduction to how you can trap data quality issues in your data pipelines.
He identified that data quality issues can be raised when:
- inputs are wrong
- your understanding is wrong
- your understanding is out of date
He introduced Great Expectations which is a library that is becoming increasingly popular in the community. It's can be used to:
- Document the rules (your "expectations") using a common language which is both Human to human and human to machine readable. It was interesting that these rules can be "softer" in nature through use of thresholds with the
mostlyargument. - Help you to build a better understanding of the data using data profiling and therefore to refine and augment the rules.
- Apply these rules to validate data at key points in your data pipelines and raise exceptions accordingly
There is a library of over 100 expectation types available to build up the rules.
He acknowledged that GX can be a little intimidating to use, partly because of the abstract concepts it uses. But Dave built up the demo in stages uncovering features and explaining how the layers of abstraction help to develop sophisticated data quality workflows through concepts such as "check pointing".
On a similar topic my colleague Liam Mooney has recently written a blog comparing Great Expectations with Pandera.
New developments in Azure Syanpse Analytics
I attended two sessions which provided a tour of a range of new features that have recently been added to Azure Synapse Analytics.
The first session ran by Pawel Potasinski and Stijn Wynants at Microsoft provided demos of a wide range of cool new features. The ones that stood out for me were:
- Serverless SQL can now read Delta tables created in Spark!
- Spark version 3.3 is now available! Providing better support for Delta format and improved performance.
- OpenAI language model integration - through a couple of lines of code you can get access to cutting edge AI. Stijn demonstrated use of
synapse.ml.cognitiveOpenAI Completion class to clean up "messy" data such as addresses, countries and dates which do not conform to a common format / syntax. Avoiding the need to write complex rules. - A number of optimisations that improves how Power BI works with Synapse in Direct Query mode.
Pawel recommended that we keep a close eye on the Azure Synapse Analytics Blog which provides monthly updates on new features that are being released, hinting that there are some exciting new features coming soon!
Ginger Grant, Principal and Founder of Desert Isle Group and data platform MVP, provided her perspectives on how changes to Azure Synapse Analytics is changing how she architects data and analytics solutions.
Ginger observed that when she engages with new clients: they all think they need a database. But in reality, in the recent past, she's only given one client a dedicated SQL warehouse, the rest just use SQL Serverless over a data lake / lakehouse. She has seen an explosion in the use of parquet and Delta as the primary means of persisting data. Lake storage is cheap and in all but a few specialised cases, it will meet the needs of most analytics workloads.
Another trend the use of code (Spark) for ETL rather than "clicky draggy" options (which will cost you more money and harder to de-bug).
Ginger provided one caution regarding the recent arrival support for R on Spark: you will need to re-write your code to take advantage of the Spark clusters.
Microsoft are clearly putting a significant investment into their data & analytics products with a significant increase in the cadence of new features being released.
We are huge fans of Azure Synapse Analytics, we have a wide range of blogs about our experiences using the platform.
Summing up
It was an action packed 3 days. Great sessions, but also many opportunities to meet fellow data professionals and make new connections. The Microsoft data and analytics ecosystem is flourishing and it will be fascinating to see what's coming next.
Final shout out is to the community that make this event possible. The event is so well organised. It was really inspiring to hear the stories from people who presented at the Community Key Note about how the community has helped them to develop their careers.
Thanks SQLbits, can't wait for next year!