Debugging NuGet Packages: Understanding Debugging Symbols and Using Source Link

Debugging allows us to troubleshoot problems in our applications by stepping through our code line by line, and stepping into methods when necessary.
The aim of this post is to understand how to debug external NuGet packages. We will present a problem you might encounter when doing so, and we'll see how understanding the internals of debugging explains the problem. Finally, we'll see how to debug NuGet packages using Source Link.
Debugging a NuGet package
When writing an application, there might be instances where we use code that we haven't written ourselves, such as methods from classes from an assembly redistributed via a NuGet package. When debugging the application, stepping into these methods might still be necessary to understand their logic and check for possible bugs.
In the example below, we have set a breakpoint in the line that uses a class WeatherHelper to call the method GetTemperatures.

When we try stepping into this line of code, the debugger steps over it instead.

Why can't the debugger step into the GetTemperatures method? The answer is that WeatherHelper class comes from a NuGet package, and the source code doesn't live in our local machine.

Let's see why this matters.
How Does Debugging Work?
Debugging Symbols
To understand why the debugger is not able to step into the method above, we need to understand how the debugger works, and how it is able to step line by line through our code and stop at breakpoints.
To run our application, Visual Studio compiles our code into DLLs (Dynamic Link Libraries). DLL files contain instructions called by programs to do certain things, like locating a file, for example. However, when debugging, the code step we through is our source code, not the code in the DLL files. So, how does the debugger know when to stop an application at the point corresponding to the breakpoint we have set?
Symbol files are the missing piece in the relationship between source code and the compiled DLL files. Symbol files have a .pdb extension, which stands for Program Database. These contain the data necessary to create a mapping between the source code and the compiled code inside the DLLs, allowing us to step through the code line by line when debugging.

PDB files can have two different formats:
- Microsoft PDB – these can download files from a Source Server (Windows only).
- Portable PDB – these use Source Link to download files (cross-platform).
When building a project in Visual Studio, the bin folder in the project folder contains a compiled DLL, and usually also a PDB file, creating the relationship between source code and compiled code.
Now that we know that symbol files are necessary to debug an application, the problem with debugging NuGet packages becomes clearer. When debugging our own code, all the assets needed live already in our machine, including the source code, the compiled DLL files, and the symbol files. However, when using external code, the source code or the symbol files might not be included in the package. That's when we encounter the situation described above and are unable to debug the source code from the NuGet package we are using.
Luckily, a technology exists that makes debugging external code possible: Source Link.
Source Link
Source Link is the technology that allows developers to debug source code from NuGet packages, when enabled. Source Link is responsible for attaching metadata to the package, containing information on the location of the resources needed by Visual Studio to debug the project's source code.
More precisely, when Source Link is enabled in a project, a JSON file is generated and embedded in the debugging symbols. This file contains information on the location of the source code in the project. Typically with NuGet packages, this will be a URL corresponding to a file in GitHub.

NuGet packages contain a .nuspec file, an XML file containing information needed to publish the package. If Source Link has been enabled in the package, there will be a repository element in this file.
This repository element in the .nuspec file will look something like this:
<repository type="git" url=[URL to the package repository] Commit=[commit version number] />
This provides three pieces of information:
- The type of source control being used for this package. Most of the time, this will be git.
- A URL pointing to the repository where the source code is. Again, this will be GitHub in most cases.
- The commit. This indicates the version used when the component was compiled, meaning the point in history in the source control system where the source files should be downloaded from.
We have found how and where Visual Studio will find the source code thanks to Source Link. But as mentioned earlier, there is a second type of file - PDB files - needed for debugging. Yet this repository tag in the .nuspec file doesn't give us any information regarding PDB files, and these are not in GitHub either.
Enabling Source Link in a package means two files will be made available together. The main package file with the .nupkg extension, and a symbol package, with the .snupkg extension. Both of those files are uploaded to NuGet.
These correspond to the two options in NuGet.org to download the package or download the symbols.

When you upload both files to NuGet.org, NuGet knows that the two files are associated. NuGet can act as a debug symbol server here, and Visual Studio can connect to it when it needs to debug symbols for a certain version of a DLL file from a NuGet package. NuGet will then serve those debugging symbols to Visual Studio.
So, in summary, after building a project with the debugger, a line of output stating that the symbols have been downloaded means the following steps happened:
- Visual Studio has checked if the symbol files needed were already in the cache. If they were, nothing else needs to be done.
- If they weren't, the type of the component needed has been determined. Most of the time, the type is a NuGet component.
- The .nuspec file has been inspected, confirming that Source Link has been enabled in the package.
- Visual Studio has downloaded the PDB symbol files from NuGet.org in the version of the package.
Once these steps has been completed, Visual Studio will be capable of debugging methods distributed via that package. When stepping into a method, it will know exactly where to download source code from, and how to step through it.
Enabling Source Link in Visual Studio
In order to use Source Code to debug the code form a NuGet package, we need to enable it in Visual Studio.
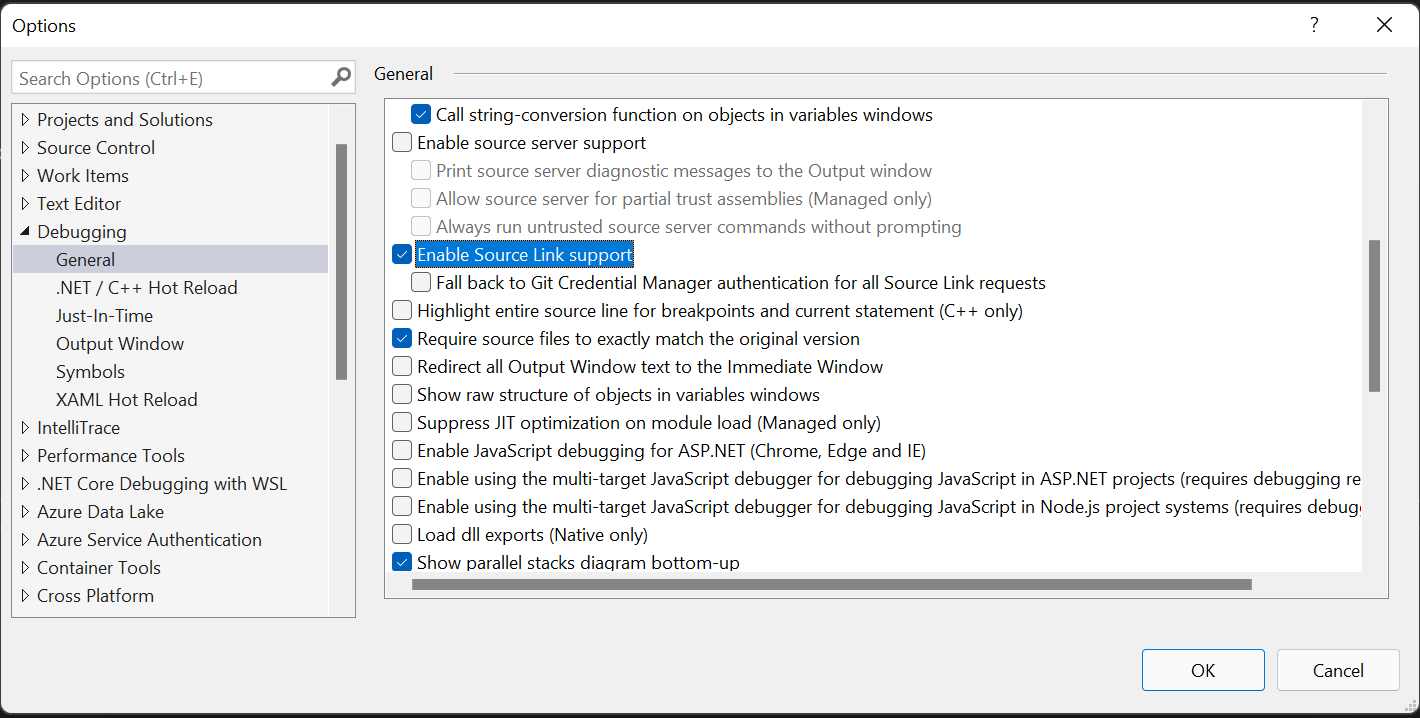
Under the Debug menu, click on Options.
First, under General, tick the option to Enable Source Link support.

Next, we need to add the NuGet symbol server to the locations where Visual Studio look symbol files.
Under Symbols in the same menu, choose the NuGet.org Symbol Server and specify the directory where you want the symbol files to be stored.

Finally, we can go back to our code, build our application with the debugger, and step into the line of code containing a method distributed via the NuGet package.
When we step into the method, Visual Studio will warn us that, in order to debug the following line of code, Source Link will need to download files containing the source code we are trying to step into. We can see that it will be downloading those files from a GitHub repository.

If we choose "Download Source and Continue Debugging", Visual Studio will download the necessary data and take us to the source code of the NuGet package in question. Once there, we are able to step through the code, just like we would with other source code that lives in our machine.
Conclusion
In this post, we explored debugging and how symbol files map the compiled DLL files to the source code, allowing the debugger to step through the code line by line as the application runs. In some cases, the source code we want to debug might belong to an external source. We have seen the different steps that are carried out by Visual Studio to be able to debug external code, enabled by Source Link, making it a seamless operation.


