The Data Product Canvas: Stop Building Data Products That Fail


TLDR; The Data Product Canvas adapts the Business Model Canvas and Data Mesh frameworks to help teams collaboratively envisage, evaluate and iterate on a data product idea before committing significant resources to it.
Data products often fail not due to technical limitations, but because they don't solve real business problems or aren't operationally sustainable.
The symptoms are:
- Misalignment - solutions looking for problems rather than addressing real pain points, analytics that don't drive actual decisions or actions, insights that arrive too late to be valuable.
- High costs, low value - high maintenance costs for low-value solutions, expensive licenses for underutilized tools.
- Strategic stagnation - businesses that are unable to respond quickly to market changes, unable to capitalize on AI/ML advances and falling behind the competition.
- Lack of engagement - users reverting to old ways of working, lack of skills and incentives to effectively use new tools, unclear ownership and accountability.
In our experience, success is most often driven by the following factors, listed here in descending order of impact:
- Clear Value Proposition - data products with a clear purpose.
- Quality Data - solid data foundations with active stewardship.
- Leadership - who set the vision, drive the roadmap and inspire change.
- Stakeholder Alignment - key decision-makers and influencers are united behind the vision.
- Champions - who lead by example when it comes to adoption of new tools and ways of working.
- Change Support - training and process redesign smooths the path from old to new ways of working.
- User-First Design - products that are accessible to all, simple to master, and impossible to live without.
- ROI Impact - a clear understanding of the lifetime costs relative to lifetime value.
- Technical Expertise - access to the skills and knowledge required to design, build and sustain a data product over its lifetime.
- Technical Feasibility - access to the technologies required to develop the product.

The path to success is clear: start with purpose, build on quality data, and create an environment where users thrive. Get these right, and technical implementation becomes the easier part of the journey.
Introducing the data product canvas
The Data Product Canvas is a blueprint for success - a simple yet powerful tool that aims to bring all of the stakeholders together to shape data products that deliver real value.
It does this by presenting 9 simple building blocks that will encourage you to think holistically about the data product.
- Audience - the specific groups of people that the data product is aiming to create value for.
- Actionable Insight - the data driven actionable intelligence that will be delivered by the data product to allow the audience to achieve a specific goal.
- Consumption - the means through which the audience will access and use the data product.
- Adoption - the support that will be given to the audience to enable them to successfully discover and use the data product.
- Lifetime Value - the value (tangible and intangible) that the data product is aiming to deliver over its lifetime.
- Data Sources - the data sources which are required to deliver the actionable insight.
- Data Processing - the actions that will need to be taken to transform data sources into the actionable insight.
- Data Skills, Tools and Methods - the key capabilities that will be required to deliver and sustain the data product over its lifetime.
- Total Cost of Ownership - the projected costs to design, build, test, operate, maintain and evolve the data product over its lifetime.

If you would like an Adobe Acrobat version of the canvas, please reach out to us.
The Data Product Canvas draws inspiration from two areas of thought leadership:
- Business Model Canvas - a visual tool for designing, exploring and iterating on new strategies and product ideas.
- Data Mesh - specifically the concept of "data as a product", which is one of the 4 key principles applied in a Data Mesh architecture.
Feedback Loops
The super power of this canvas is that it enables positive feedback loops: one of the unsung strengths of the Agile approach.
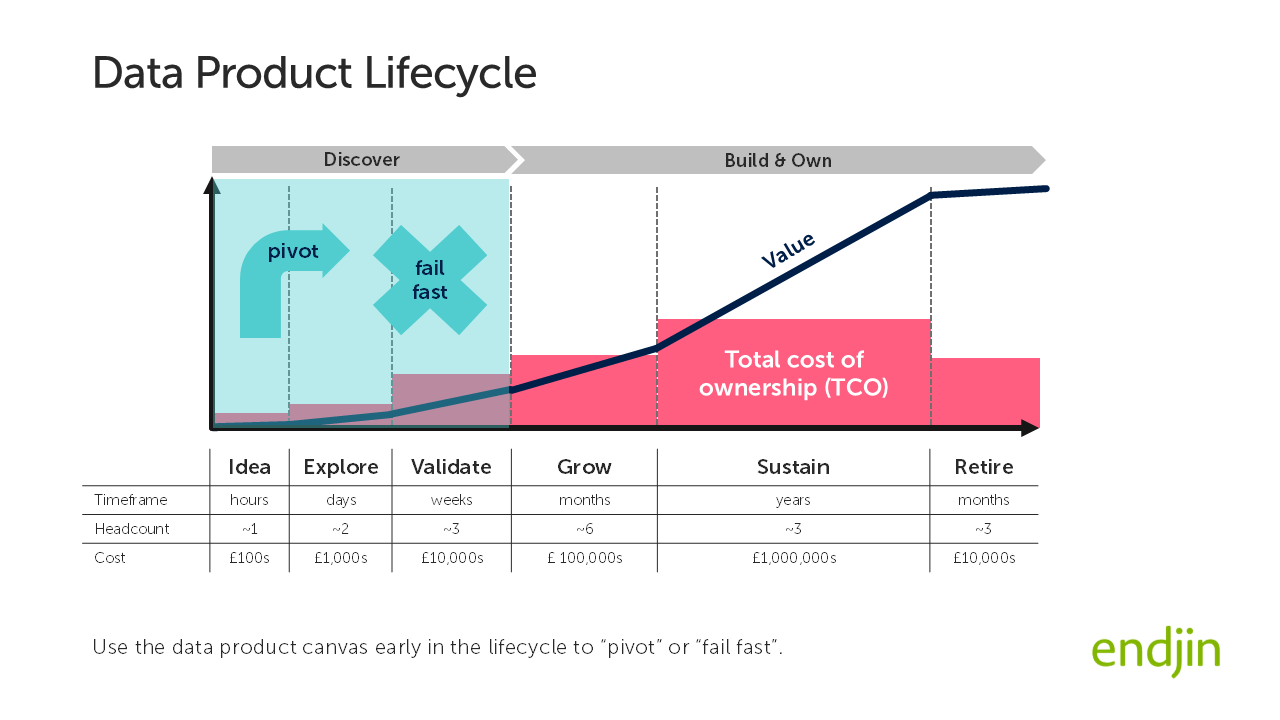
The canvas is primarily intended for use early in the lifecycle before any effort or budget is consumed on implementing the data product. It achieves this by holding a mirror up those who are considering the idea, with the objective of allowing them to dispassionately evaluate the feasibility and to highlight in advance the key barriers they will need to overcome to make the data product a success.
The process of completing the canvas is iterative in nature. It will require you to conduct short conversations with different stakeholders, with each conversation allowing you to illuminate a specific area of the canvas, uncover new information or raise questions that require you loop back and re-consider areas of the canvas you may already have populated.
At some point in completing the canvas, you may need to fundamentally re-think the idea (a practice often referred to as a "pivot") or decide that the idea simply isn't feasible (i.e. to "fail fast"). Either is a positive outcome, as it is better to do this whilst the idea is still on paper rather than further down the lifecycle when significant budget has been expended!
The cheapest thing you can do it talk, the most expensive thing you can do is code!
Looking Ahead: Making Data Products Work
The technology landscape has transformed dramatically in the last decade. The pandemic forced many organisations to make decisions from data rather than from gut feel face-to-face interactions. The more recent emergence of Generative AI has sparked fresh enthusiasm for data-driven transformation.
The key challenge is choosing the right opportunities and understanding what is necessary to implement them successfully as a socio-technical endeavour. Organisations face several critical questions:
- How do we prioritize competing ideas for data products?
- Where will our investments have the most significant impact?
- How do we ensure successful implementation?
- How do we align stakeholders and resources effectively?
- Do we have the necessary skills and knowledge to deliver this on time, within budget?
The Data Product Canvas offers a framework to answer these questions. By encouraging you to take a collaborative approach to envisioning, evaluating, and iterating on data product ideas, it helps teams:
- Identify high-impact opportunities
- Anticipate implementation challenges early
- Consider cultural and organizational factors
- Build stakeholder alignment
- Make informed investment decisions
Organizations today face a critical disconnect: soaring ambitions for AI and data transformation, but earthbound budgets and resources to achieve them. It's the classic "champagne ambitions versus sparkling water budget" dilemma, but with high-stakes consequences for business competitiveness.
Without a structured approach to evaluating data initiatives, organisations risk wasting limited time, resources on budget on failed data products. The Data Product Canvas is a useful tool for preventing expensive mistakes and identifying winners before you invest. In an era where every failed data project means lost market share and competitive advantage, organizations can't afford the traditional "build it and they will come" approach.


