How to step into external code when debugging a Python Behave test in VS Code

If you want to step into external code when debugging a Python behave test, you will find that the usual VS Code mechanisms for configuring debugging do not work. In this post I'll show you how you can enable this.
TLDR; In settings.json add the following line: "behave-vsc.justMyCode": false. (Note: this is a setting for the behave VS Code extension, so you'll need to have that installed for this to work.)
Before getting into it, first a note about the my environment – I am using the behave VS Code extension to run behave tests. This extension is useful as it allows you to run behave tests through the native VS Code test UI. It is also an important part of the solution to the problem, as you will see shortly.
A launch configuration doesn't help
In VS Code, you configure debugging by creating a launch profile in .vscode/launch.json. Here's a basic launch profile for debugging a Python test, copied from the Debug Tests section of the VS Code documentation on Python testing:
{
  "name": "Python: Debug Tests",
  "type": "debugpy",
  "request": "launch",
  "program": "${file}",
  "purpose": ["debug-test"],
  "console": "integratedTerminal",
  "justMyCode": false
}
If you have done much development in VS Code, launch profiles are likely to be familiar to you; if not, you may be interested to read the VS Code debugging documentation. The relevant setting here is justMyCode, this controls whether the debugger steps into external code when you "Step into" (F11) a function or type defined in code outside of your project or not. A value of false enables this, a value of true disables this.
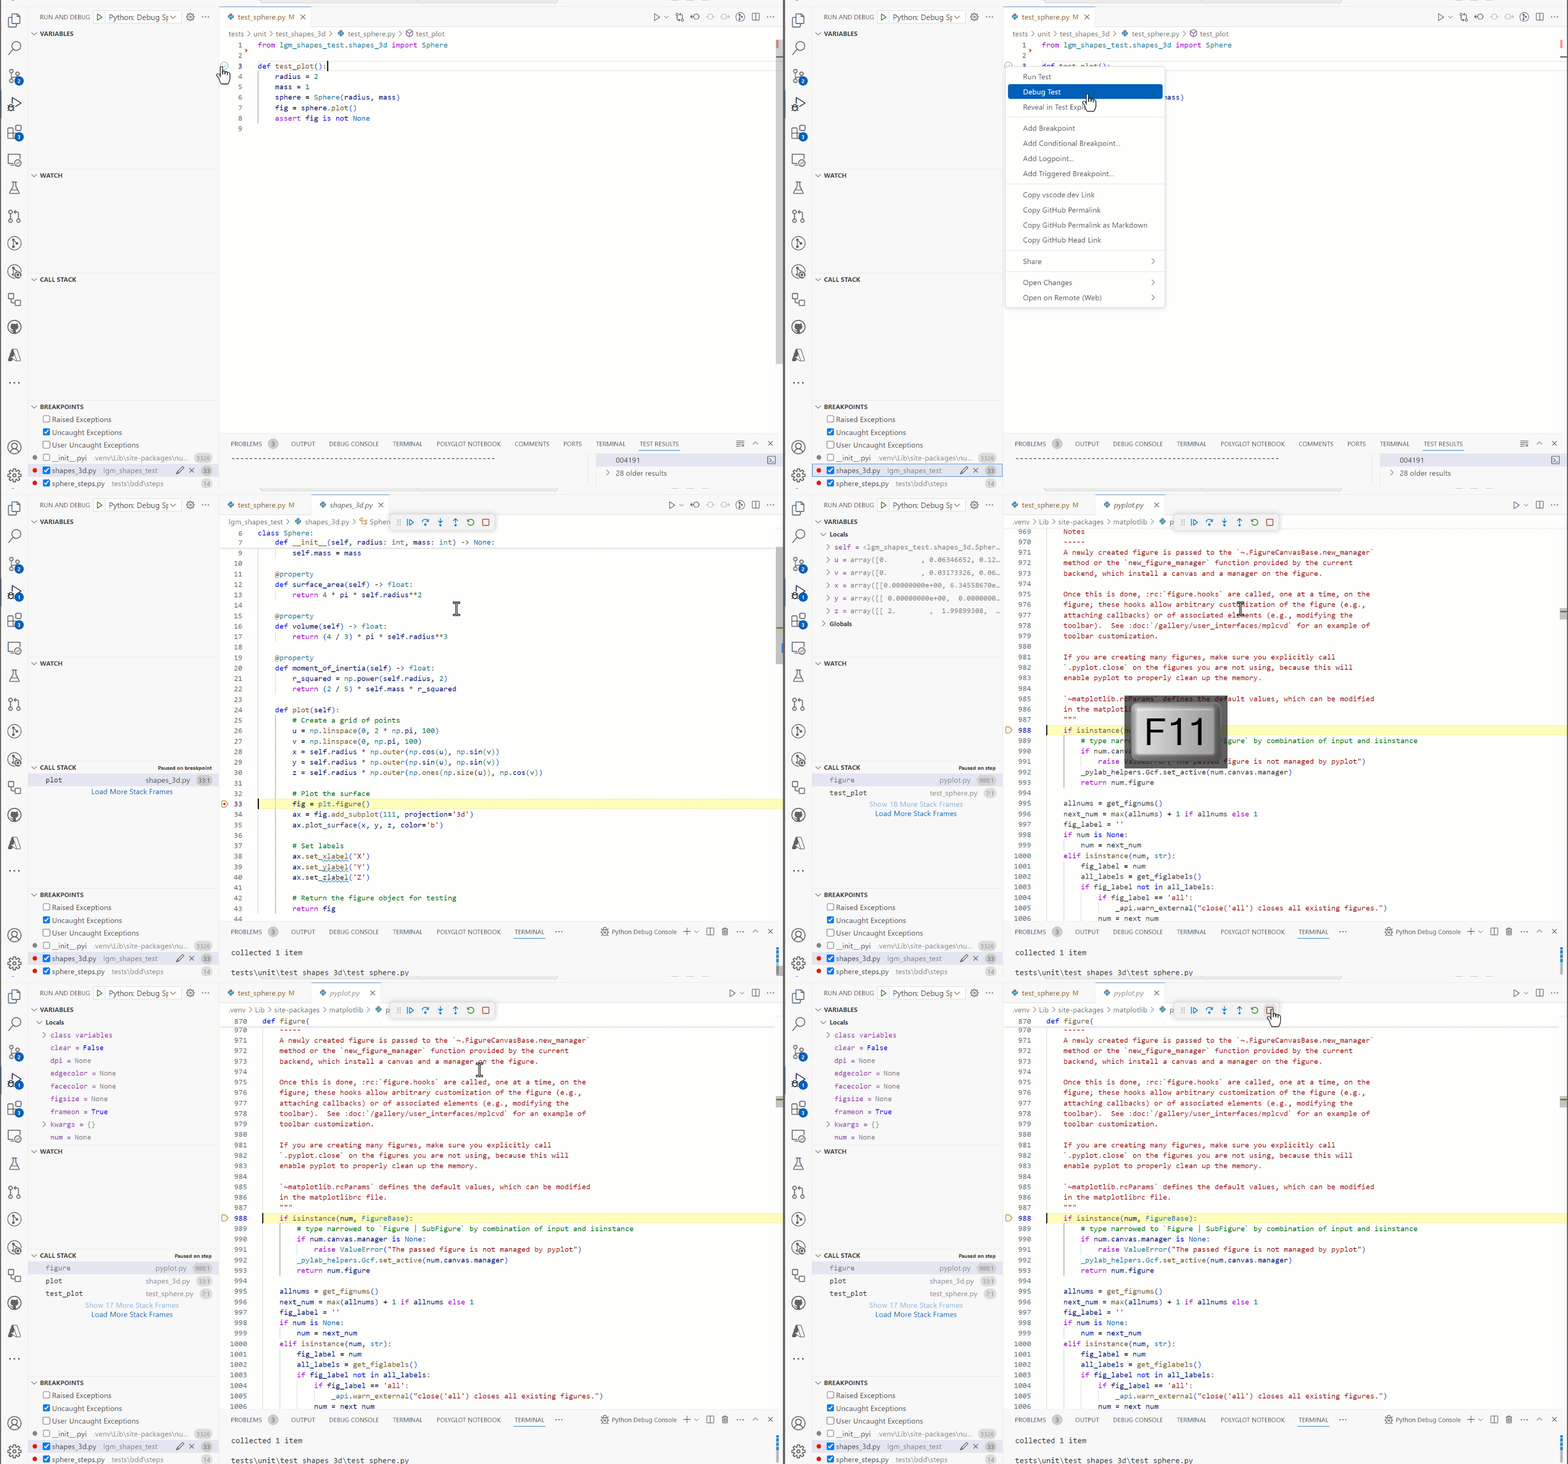
With this launch profile I am able to step into external code when debugging plain Python tests – standard methods that use the assert keyword (this also works with PyTest tests). The gif below demonstrates this by stepping into the matplotlib package's figure function, which gets invoked by my code.

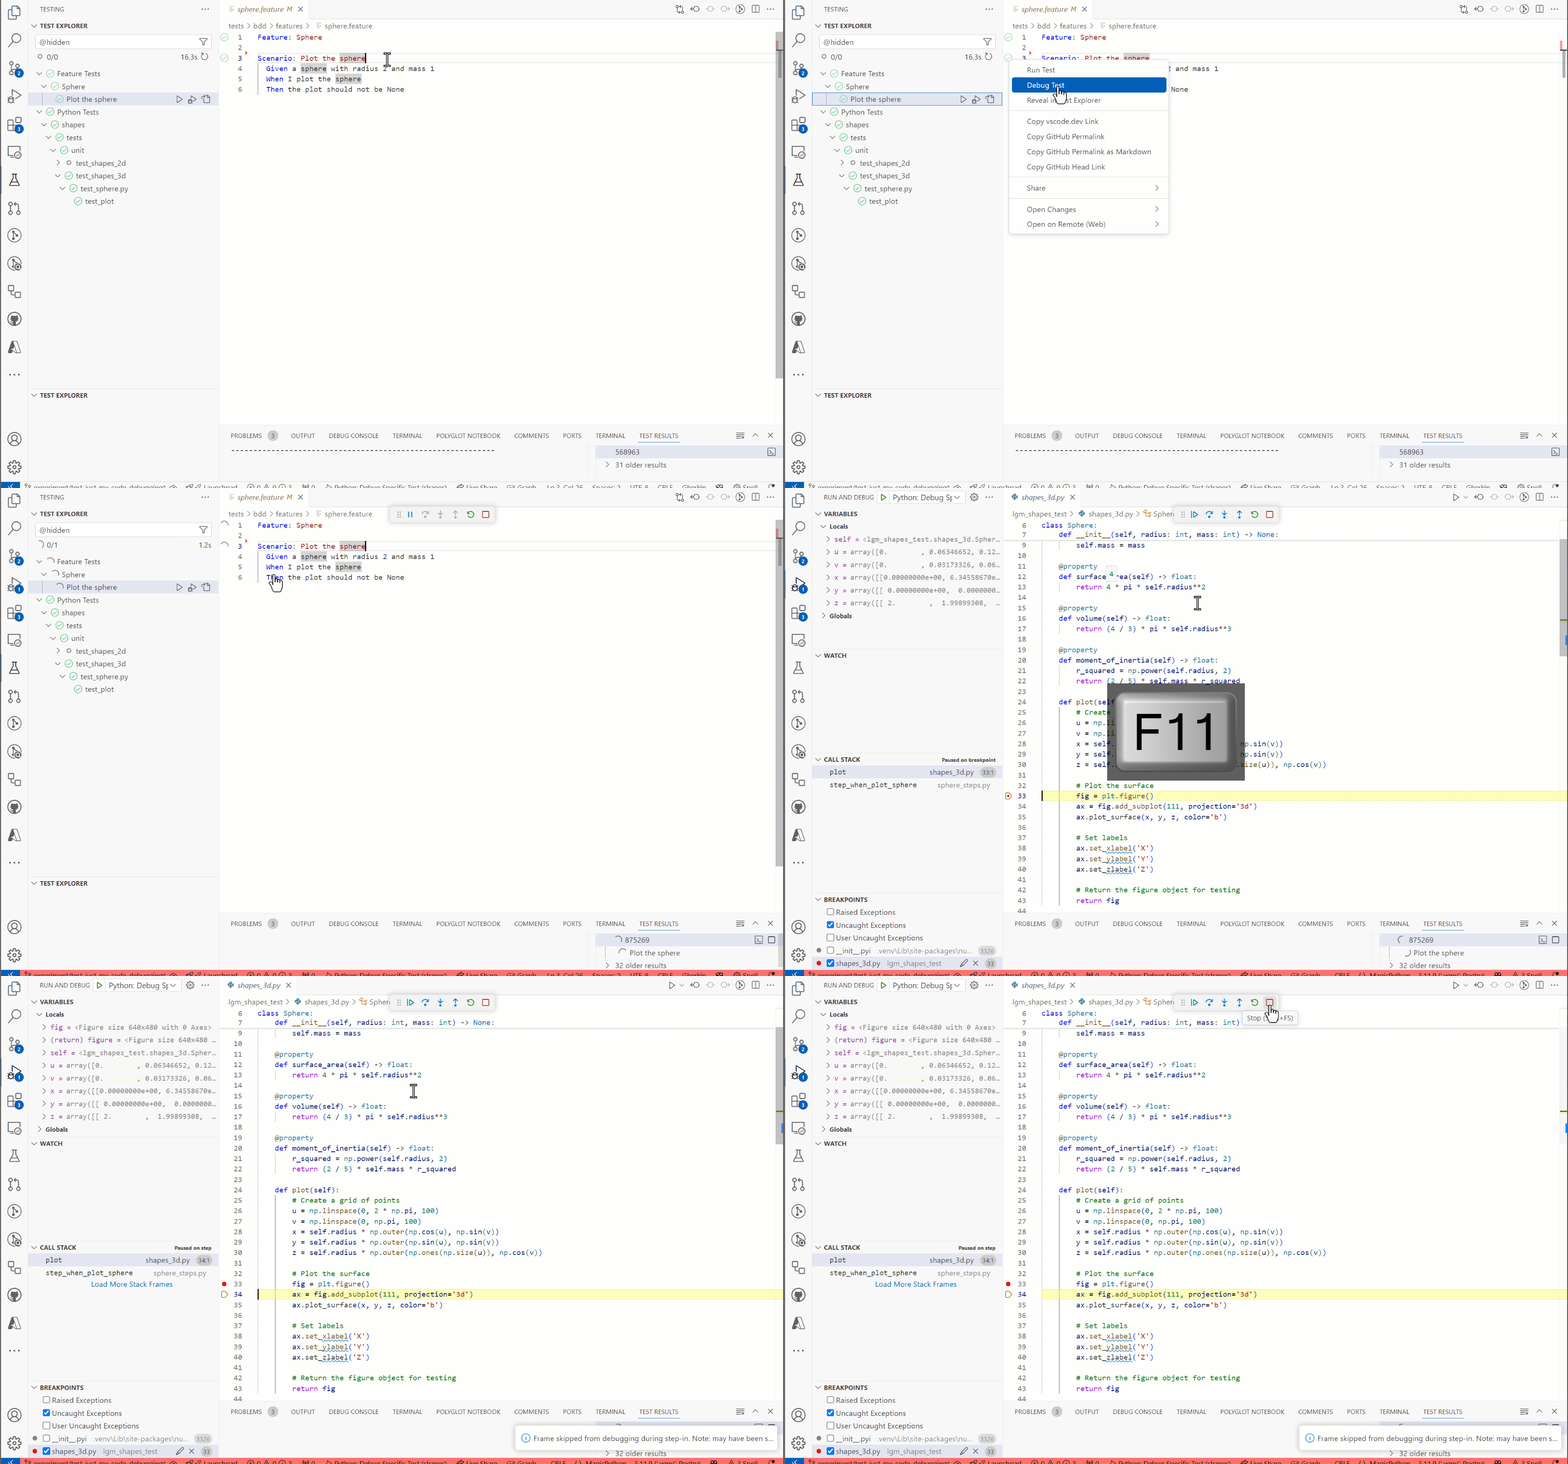
However, for the equivalent behave BDD test, this doesn't work – when I click "step into" (F11), the debugger just steps over. See the gif below.

There's clearly something different about debugging behave tests that means it just ignores the debug settings in launch.json. Why?
Read the docs!
The official behave VS Code extension docs tell you exactly why in the section How debug works:
"It dynamically builds a debug launch config with the behave command and runs that. (This is a programmatic equivalent to creating your own debug launch.json and enables the ms-python.python extension to do the work of debugging.)"

In other words your launch.json is completely ignored by the behave extension.
The next bullet point explains how you can enable stepping into external code:
"You can control whether debug steps into external code via the extension setting behave-vsc.justMyCode (i.e. in your settings.json not your launch.json)."
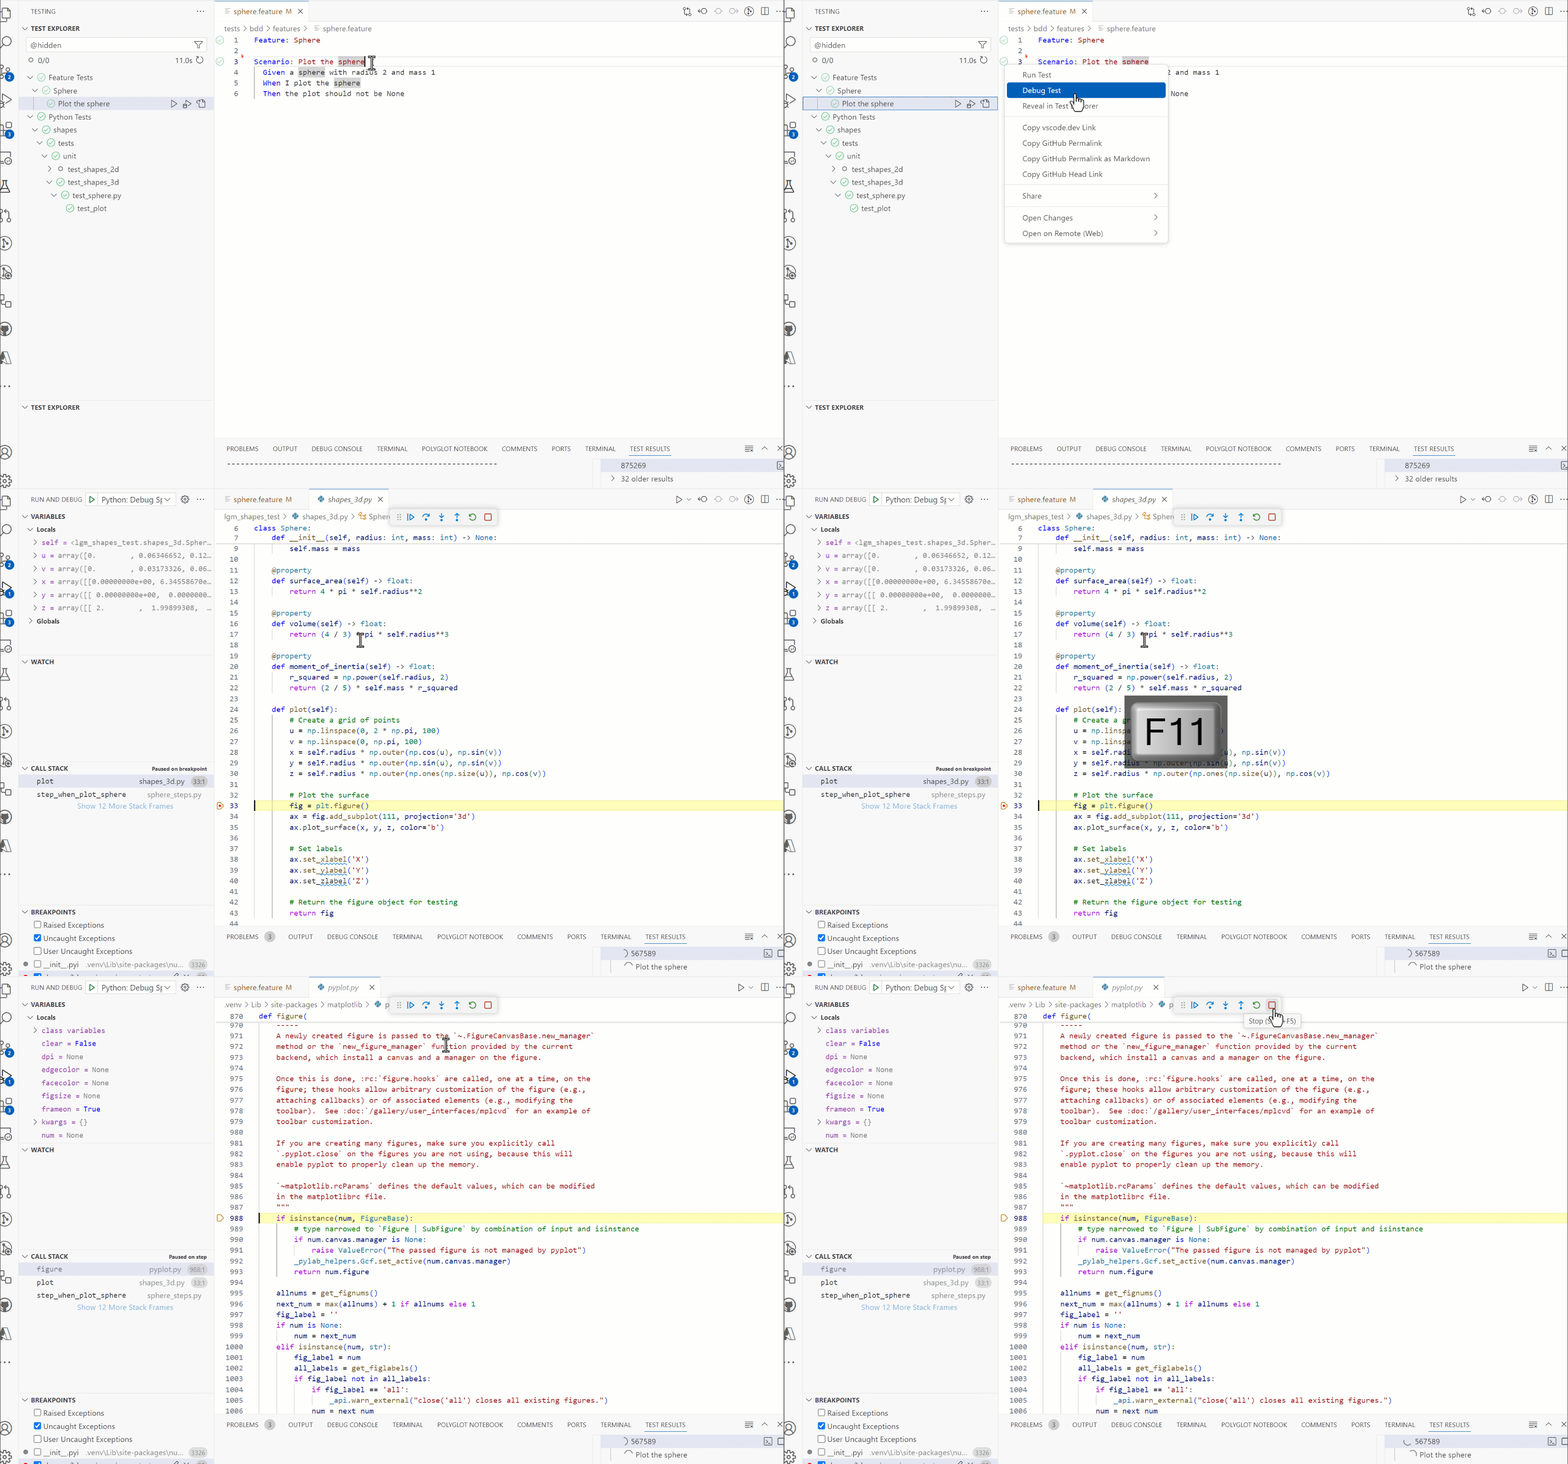
So, we need to add the following line to our settings.json file "behave-vsc.justMyCode": false. And this works:

The lesson from this is: Read the docs! However, the behave extension's behaviour of defining its own launch setting was slightly surprising to me, as it's different to the configuration model to the other types of Python tests I have worked with. Also, some basic web searches around this didn't help much; I actually stumbled upon the correct setting accidentally. Anyway, I thought it would be useful to get this out there, hence the blog.


