Working with JSON in Pyspark


TL;DR Having a document based format such as JSON may require a few extra steps to pivoting into tabular format. This blog talks through how using explode() in PySpark can help to transform JSON data into a PySpark DataFrame which takes advantage of Spark clusters to increase processing speeds whilst managing your nested properties.
As part of rolling out the adaptation of OpenChain across endjin's code base we have been generating SBOM data which is formatted in JSON, along with metadata about CodeOps processes. We loaded the data into an endjin synapse Azure Data Lake Store (Gen2), we then use a Azure Synapse Notebook to transform the data, and the notebook is then hosted in an Azure Synapse Pipeline in order to productionise the process. We were working with deeply nested JSON, meaning it wasn't a case of a simple conversion. I explain the steps we took in this blog.
What is PySpark?
PySpark is the Python API for Apache Spark, it applies SQL-like analysis on large sets of data. This data is run using a cluster which is a group of connected computing nodes which work together as a whole, which are partitioned to be run in parallel. This makes processing times much faster for large sets of data because of parallel processing meaning multiple processors are working simultaneously.
Example Test Data
Here I created a test C# project and imported Newtonsoft.Json as an example package.

Then using Covenant to generate an SBOM in a custom JSON format rather than the standard CycloneDX/SPDX, it generates the following output:
{
  "Name": "PySparkExample",
  "Version": "0.0.0",
  "ToolVendor": "Covenant",
  "ToolVersion": "0.12.0+ec84391de1b7c13b5a4e39bfed49db7f199b0d86",
  "Components": [
    {
      "Data": "1.0.0",
      "UUID": "fd90c2b1-4450-4c72-b3f2-f395ba161749",
      "Purl": "pkg:covenant/dotnet/PySparkExample@1.0.0",
      "Name": "PySparkExample",
      "Version": "1.0.0",
      "Groups": [
        "PySparkExample.sln"
      ],
      "IsRoot": true
    },
    {
      "Data": "13.0.2",
      "UUID": "e2701915-6fcc-4a4c-aa5e-f068b43bebe4",
      "Purl": "pkg:nuget/Newtonsoft.Json@13.0.2",
      "Name": "Newtonsoft.Json",
      "Version": "13.0.2",
      "Kind": "Library",
      "Copyright": "Copyright © James Newton-King 2008",
      "Hash": {
        "Algorithm": "SHA512",
        "Content": "D743AE673BAC17FDBF53C05983DBA2FFDB99D7E6AF8CF5FE008D57AA30B6C6CA615D672C4140EEC516E529EB6AD5ACF29C20B5CC059C86F98C80865652ACDDE1"
      },
      "License": {
        "Id": "MIT",
        "Name": "MIT License",
        "Url": "https://licenses.nuget.org/MIT"
      }
    }
  ]
}
Importing the data into PySpark
Firstly we have to import the packages we will be using:
from pyspark.sql.functions import *
I import my data into the notebook using PySparks spark.read
df = spark.read.load(
    '[PATH_TO_FILE]',
    format='json',
    multiLine=True,
    schema=None)
df is a PySpark DataFrame, it is equivalent to a relational table in SQL. To view the DataFrame you have to use display() otherwise if you try to print the table just df you get a schema of the table:
DataFrame[Components: array<struct<Copyright:string,Data:string,Groups:array<string>,Hash:struct<Algorithm:string,Content:string>,IsRoot:boolean,Kind:string,License:struct<Id:string,Name:string,Url:string>,Name:string,Purl:string,UUID:string,Version:string>>, Name: string, ToolVendor: string, ToolVersion: string, Version: string]
Which then results in this when displaying using display(df):

As you can see, in the component column all the data is in one column. This is because the data is being stored as an array so will need a few more steps to pull it out of this format.
Then we need to select out the metadata about the SBOM run, rather than actual information about the components.
Metadata = df.select(
     col('Name'),
     col('ToolVendor'),
     col('ToolVersion'),
     col('Version')
 )
The picture below shows the new table metadata after we have selected the columns we need from the original 'df' dataframe.
| Name | ToolVendor | ToolVersion | Version |
|---|---|---|---|
| PySparkExample | Covenant | 0.12.0+ec84391de1b7c13b5a4e39bfed49db7f199b0d86 | 0.0.0 |

Now we want to work on getting the components data out of the original df table. We take the same approach with the select as we did with the metadata.
First we want to take the column 'Components' and because all the data is stored in an array, we explode the values. Explode creates a new row for each element in the array of results. Because we only had 2 separate components we are left with 2 rows:
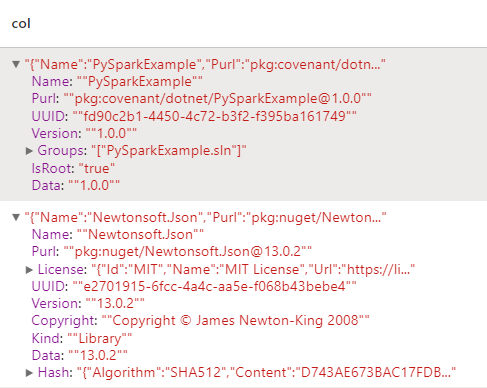
You can see within each row are individual key-value pairs and more embedded JSON. Because our data doesn't follow a set schema, is different for each component, and not each one needs exploding, we can just select out each part of our information again using select.
ExpandedComponents = Components.select(
    col('col').getItem('Name').alias('Name'),
    col('col').getItem('Purl').alias('Purl'),
    col('col').getItem('UUID').alias('UUID'),
    col('col').getItem('License').getItem('Id').alias('License_ID'),
    col('col').getItem('License').getItem('Name').alias('License_Name'),
    col('col').getItem('License').getItem('Url').alias('License_Url'),
    col('col').getItem('Version').alias('Version'),
    col('col').getItem('isRoot').alias('isRoot'),
    col('col').getItem('Data').alias('Data'),
    col('col').getItem('Kind').alias('Kind'),
    col('col').getItem('Hash').getItem('Algorithm').alias('Hash_Algorithm'),
    col('col').getItem('Hash').getItem('Content').alias('Hash_Content'),
    col('col').getItem('Copyright').alias('Copyright'),
)
Above you can see we used 'col' to get the column name, currently all the data is only in that one column from Components called 'col'. To get each item within the column we can use getItem() using the name of the key, and then following getItem() we can use alias() which renames the column. The reason we don't want to use a loop to do this because if we did we'd lose the advantage of being about to process this data quickly using partitioning of clusters. By using explode, and these getItem() functions, when the notebook runs, we can get really fast processing speeds.
| Name | Purl | UUID | License_ID | License_Name | License_Url | Version | isRoot | Data | Kind | Hash_Algorithm | Hash_Content | Copyright |
|---|---|---|---|---|---|---|---|---|---|---|---|---|
| PySparkExample | pkg:covenant/dotnet/PySparkExample@1.0.0 | fd90c2b1-4450-4c72-b3f2-f395ba161749 | 1.0.0 | true | 1.0.0 | |||||||
| Newtonsoft.Json | pkg:nuget/Newtonsoft.Json@13.0.2 | e2701915-6fcc-4a4c-aa5e-f068b43bebe4 | MIT | MIT License | https://licenses.nuget.org/MIT | 13.0.2 | 13.0.2 | Library | SHA512 | D743AE673BAC17FDBF53C05983DBA2FFDB99D7E6AF8CF5FE008D57AA30B6C6CA615D672C4140EEC516E529EB6AD5ACF29C20B5CC059C86F98C80865652ACDDE1 | Copyright © James Newton-King 2008 |
As you can see now, all of our data has been expanded out from it's nested form meaning it's much easier to be analysed. From here you can save it back to the datalake, as a parquet file, or can be passed into a pipeline as the next stage of a process.
To save to parquet:
ExpandedComponents.write.parquet(
    "[PATH_TO_FILE]",
    mode="overwrite")
You can partition by name, which means it will split each unique name into a new folder. Partitioning allows you to increase performance whilst minimising query costs. In this example it isn't that useful to do that because we only have a small dataset, but where you have a bigger dataset, this could be useful for splitting up your data.
Conclusion
When using PySpark you want to be careful when writing your code to be aware of whether you are making the most out of the spark clusters, and the partitioning of processing. Working with JSON in Python can be tricky when you have deeply nested values, but using the right tools can make it a lot easier.