Insight Discovery Part 5: Delivering insights via data pipelines


TLDR; The traditional, bottom-up, data modelling approach to data warehousing leads to compromised data platforms that are hard to evolve, expensive to run, and don't meet the needs of the business. Endjin's Insight Discovery process helps you to ask the right questions of the business, so that you can design a data platform that fully meets their needs.
Insight Discovery
This series of posts, and the process that they describe, will help you ensure that your data projects are successful. That the time, money and energy that you or your organisations are investing in strategic data initiatives are well spent and that they deliver real business value.
They describe a different way of thinking, a shift in mindset, in how to approach data projects, that puts the consumer and the outputs front and centre of the process.
In the previous post in the series, I explored the prioritisation of data insights so that you can deliver incremental pieces of value. But how do you actually deliver them incrementally, so that you reduce the time it takes to provide an insight to the business, rather than having to wait for a huge monolithic platform?

In this post I'll explain how modern data platform architectures, specifically cloud data pipelines, enable and support this agile, iterative data insight delivery process.
Deliver insights with data pipelines
Where do you start when you have actionable insight number 1, and you've identified the evidence to answer the first question that you need answering, through the right channel, with the right feedback loops?
In order to know if we should increase the number of call centre staff on a shift, we said that we'd need to know how busy we are. One of the pieces of evidence we identified earlier that would tell us how busy we are, was the number of issues that we're resolving per hour.
So, "number of issues resolved in the last hour" is the output that we're aiming for in order to answer the specific question.
The most optimal structure of data to serve that output would be a count of issues by time. This allows us to easily and efficiently query the number of issues resolved in the last hour.
This means we need get hold of the issue logs and potentially pivot, aggregate or transform them to be in a time series.
And we know that the issue logs can be extracted from our ticketing system.
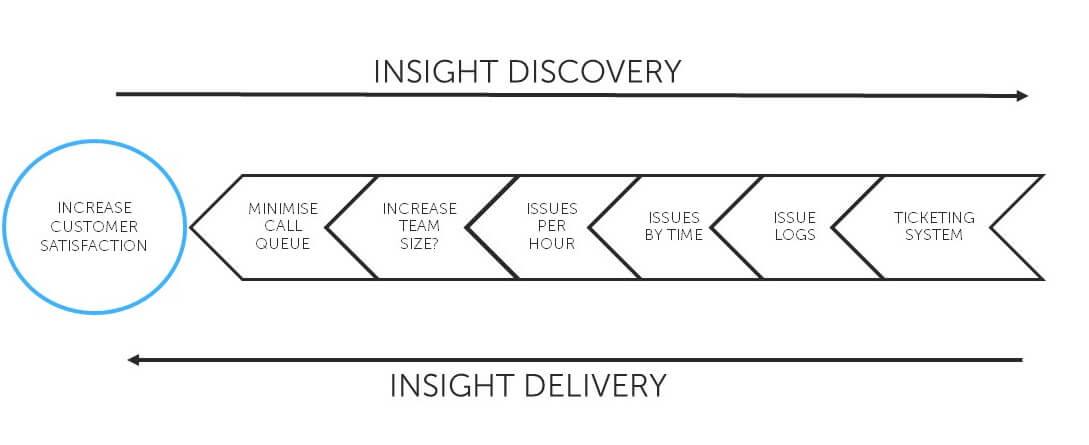
What we've defined is a pipeline. The only difference is that we've worked backwards from the output to get to the data. But that's an important difference as we know that by focusing on delivering this pipeline, we have something valuable. So that's what we should do. We don't try and solve all the problems at once, we tackle them one at a time, always delivering incremental pieces of value to the business.
Some or all of you will have come across pipelines before - they're central to a lot of cloud analytics platforms - for example Azure Data Factory or Synapse Pipelines. Pipelines enable agile and iterative delivery - thin, optimised horizontal slices through your data platform that are providing specific pieces of value.
Pipelines also allow for polyglot processing - so you can pick the best choice in the ingestion/transformation and modelling for the specifics of the insight that the pipeline is generating. You're not trying to design for everything up front, so you don't need to bake in compromise.

Because they're aligned to specific piece of business value, you can also align cost controls and security boundaries to the business units that care about them.
And the pipeline pattern scales really well. As you tackle more and more insights, and more and pipelines, you'll find repeatability and reusability along the way.
The technology can and should support the process that I'm describing. If you adopt an actionable insights based approach to your data projects, a pipeline based architecture is a really effective way of delivering them.
There may be multiple models
For example, the output of one pipeline might be the starting point of another. So rather than a single centralised model, the pipeline based approach can easily lead to different data representations from the same source to serve different purposes. We call these "data projections", or "data APIs". Reusable data structures that can layer on top of each other to provide targeted use cases, with traceability and lineage all the way from the source.
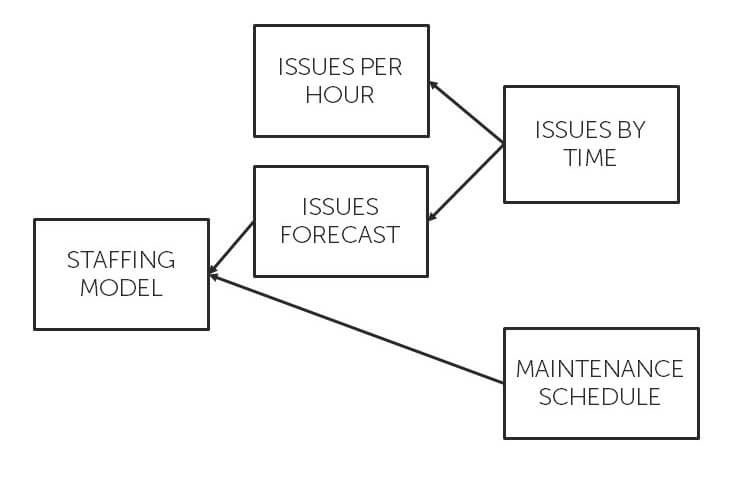
Our "issues by time" data projection that we used to calculate the number of issues resolved in the last hour, could also be used for other purposes. We could use it to forecast what this might look like for the next hour, day, or week. And we could combine that forecast projection with other data sources, like the planned maintenance schedule to run what if scenarios over various staffing patterns, which might result in another data projection.
It's normally around this point that the subject of star schemas and facts and dimension tables comes up - are we saying we should forget them altogether? And I'llbe clear that I'm definitely not saying that.
What I am saying is a single, centralised up-front star schema design is, in our experience at endjin, going to cause all the problems that I outlined early in this series.
But, building a star schema as an output, that's entirely tied to one or more of the actionable insights is an absolutely valid approach. One of the best examples of this is within a Power BI tabular model. If a Power BI report is the correct output to deliver the actionable insight in the right way, then great. But remember - the model in the Power BI report is there to serve a purpose - to deliver a specific set of well defined insights to a specific audience. You could also think of this as a the difference between producing a semantic model, rather than a centralised canonical model.
The thing to remember is that there are many options when it comes to cloud storage and you don't always need a star schema in a data warehouse to efficiently store your data insights. If you've worked backwards from the desired outputs, you know exactly what the optimal data structure should be to support them, so you can pick the optimal storage choice for each stage of the pipeline according to how it's going to be used.
So, modern cloud data architectures support and enable the iterative delivery data platforms, which goes hand in hand with the Insight Discovery process that I've been describing in this series of posts. This means that you now have a process to define what you're trying to do, and a set of tools in order to do it.