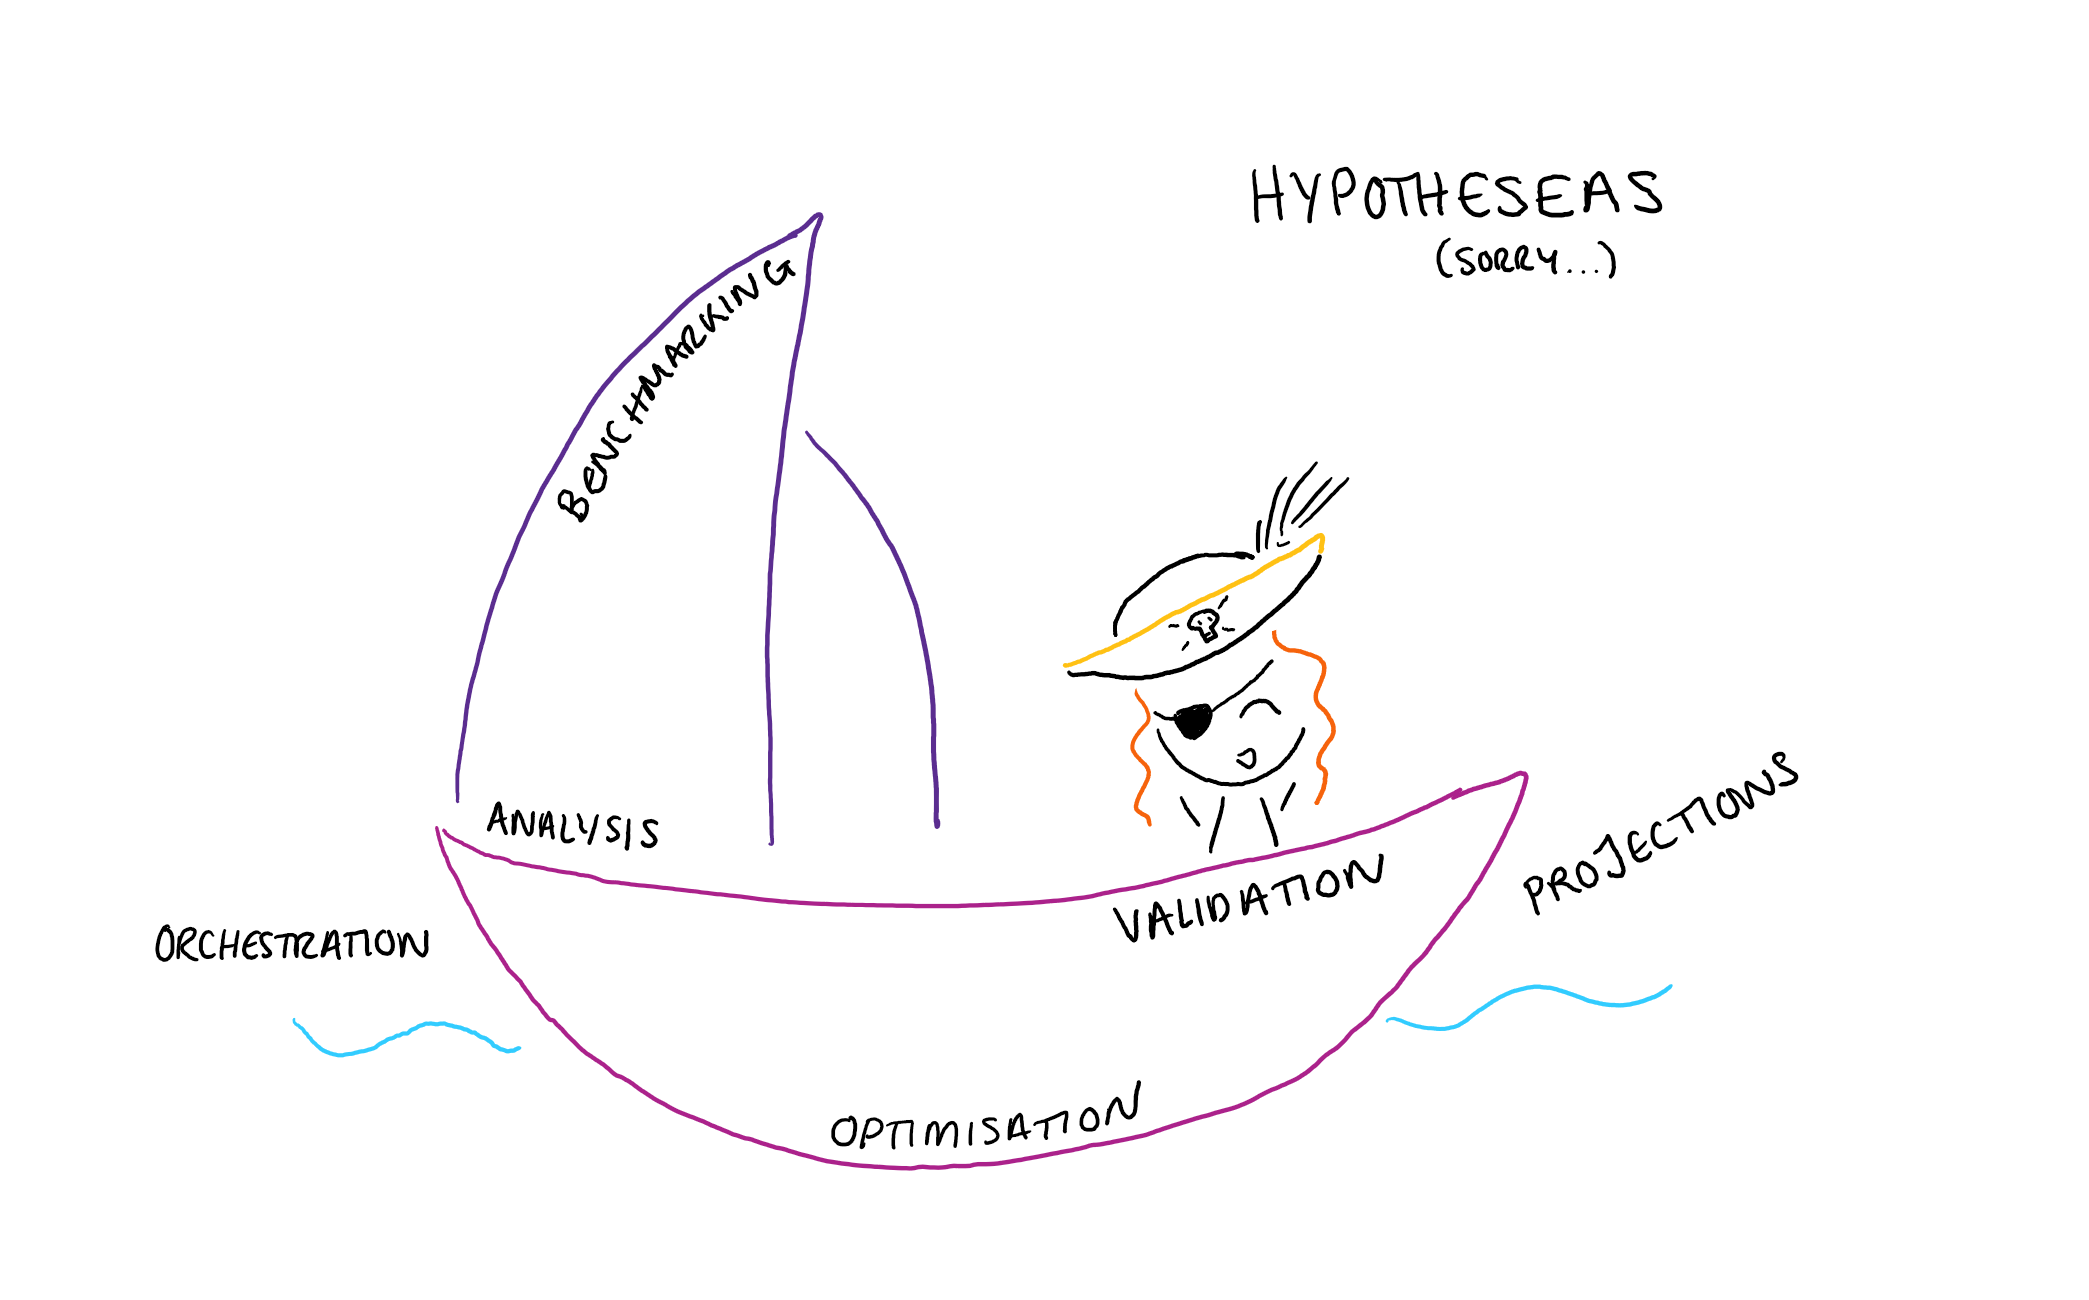
Building a proximity detection pipeline


I've spoken a lot about our recent project with OceanMind where we developed a serverless architecture for processing large quantities of vessel data. One of the things we needed to detect as part of the processing was vessel proximity. We needed to detect vessels that were within a certain distance of one another for a certain amount of time. I think that the process we went through in doing this is an important one to highlight, so here goes!
The problem
The problem is in it's essence a simple one - we needed to use vessel point data to build up vessel tracks, and then run analysis over those tracks in order to detect vessels which travelled within a certain distance of one another. Proximity events are one of the factors that OceanMind needed to feed into their machine learning models in order to detect illegal fishing.
We had done some preliminary cost analysis of both lifting and shifting the existing system, and of the possibility of using a database solution which had geospatial features (such as CosmosDB) and had found that both of these options were prohibitively expensive. So, we came up with an alternative.
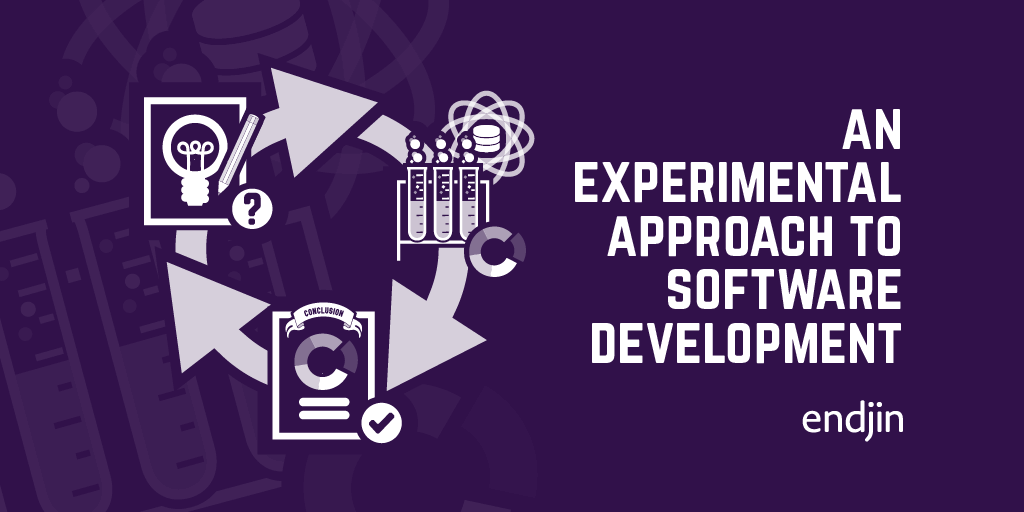
Our hypothesis
I have recently blogged about integrating scientfic experimental method into software design. Inkeeping with this, when we started the project, we defined our hypothesis:
"We will be able to do the processing we need using ADLS, Azure Functions and .NET"

We also had out success criteria:
- We can process 2000 events/sec
- We can do this within the budget constraints
Once we had our hypothesis, we set about a proof of concept in order to prove/disprove it.
The proof of concept
The first step was to establish that we could actually build up the processing we needed to do using C#. At this point I actually got out a pen and paper and put some of my degree knowledge to the test! (I say this, I actually had to Google the quadratic formula 'just to check', which really throws many years of education into question...)
But, essentially the analysis consisted of taking the start and end of a segment of vessel track and using the average velocity between those two points to find an equation for the position in both the x and y direction (the coordinates were actually in lat/long but we were able to approximate these to planar coordinates at the scales we were looking at - which we validated as part of the experiment!).
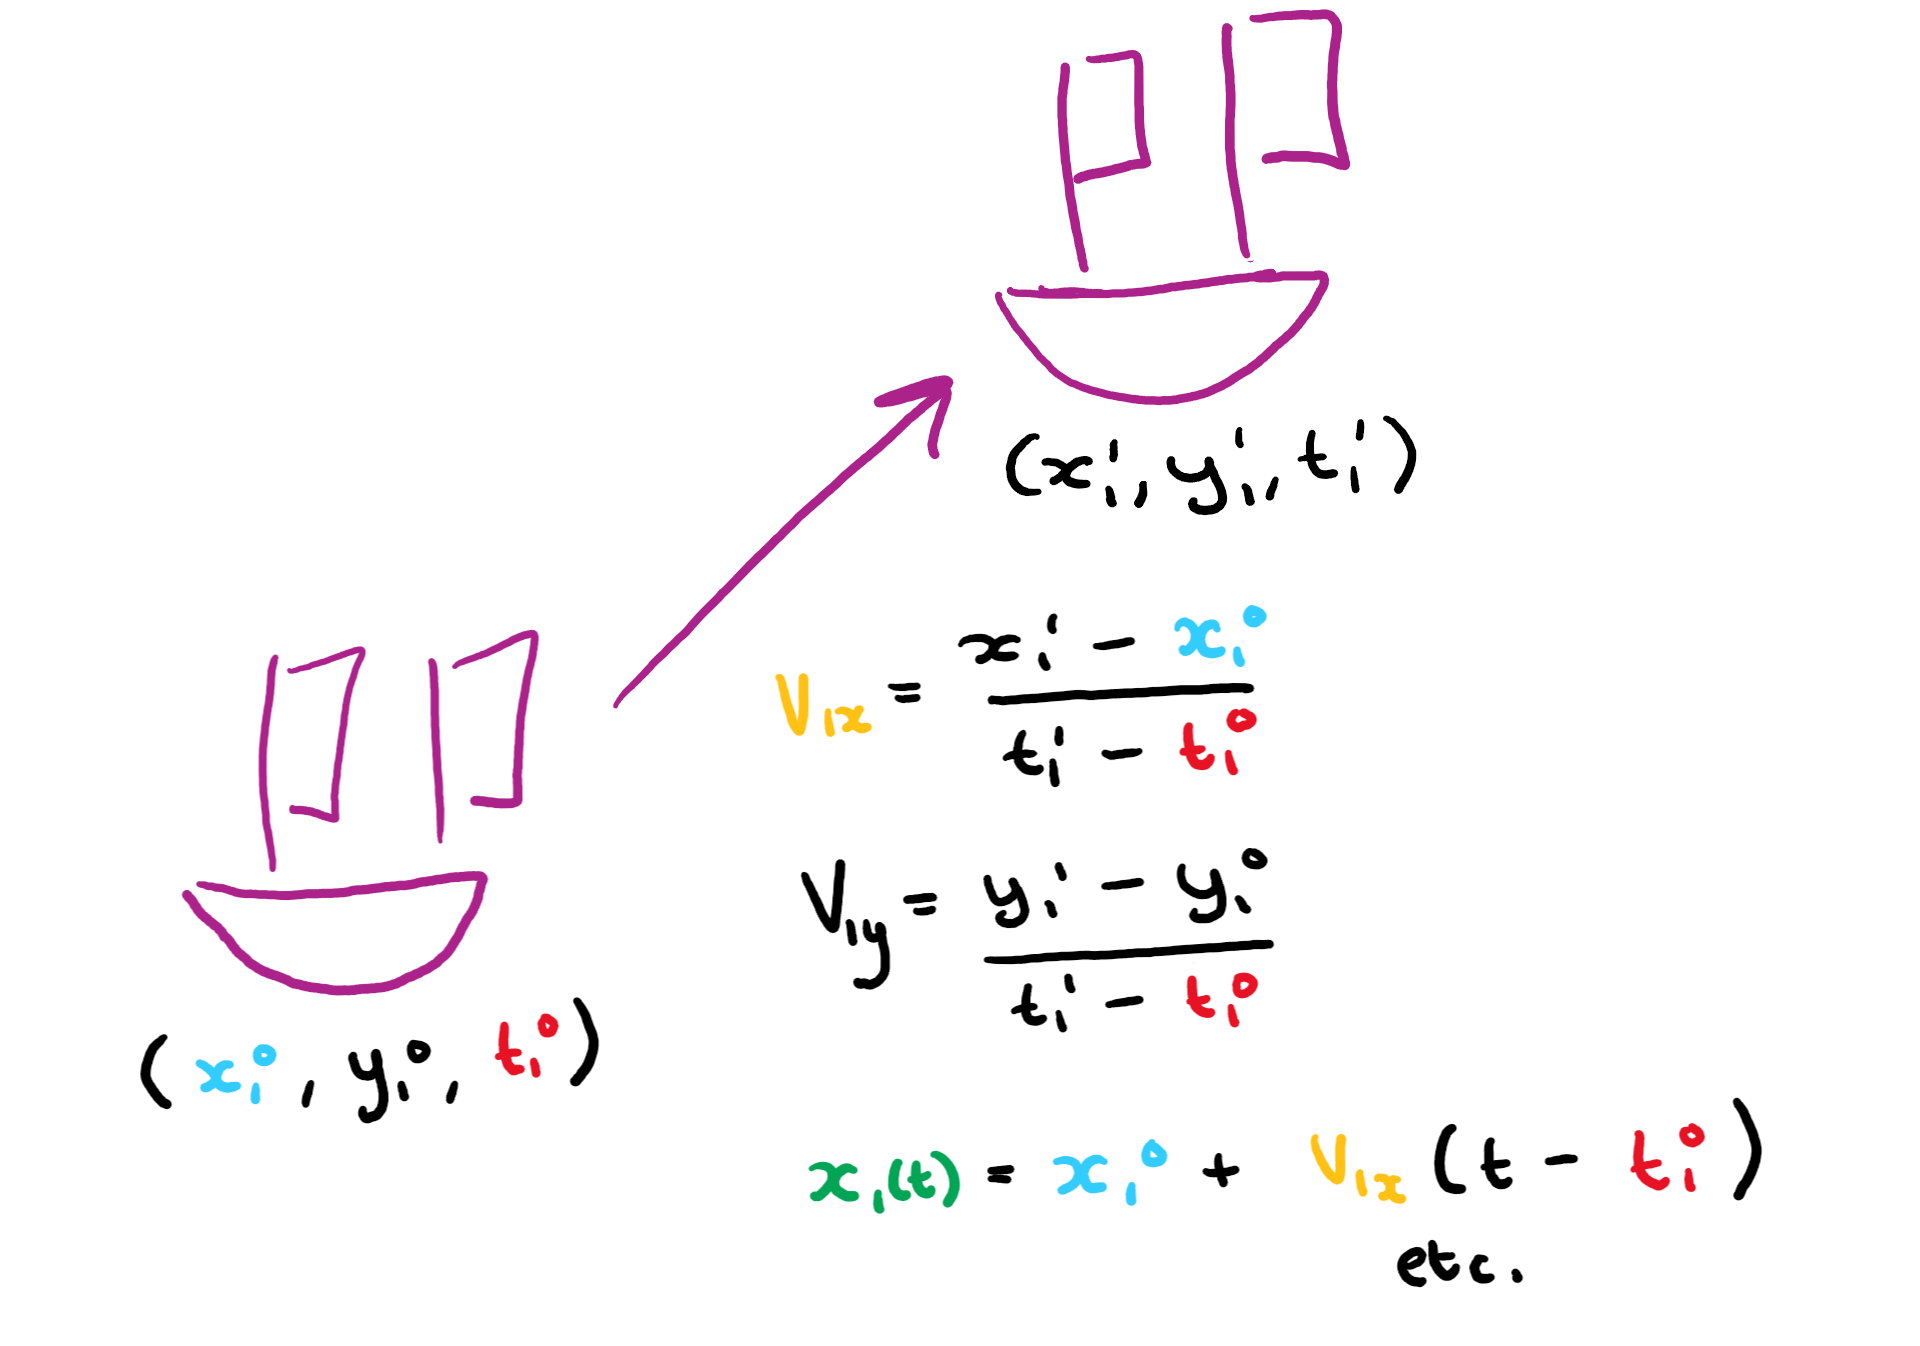
So here we have equations for the velocity in each direction, and using these the equations for the vessel's position in each direction over time.
By pythagoras, the square of the distance between two vessels is then just the squares of the difference in their position in each direction.
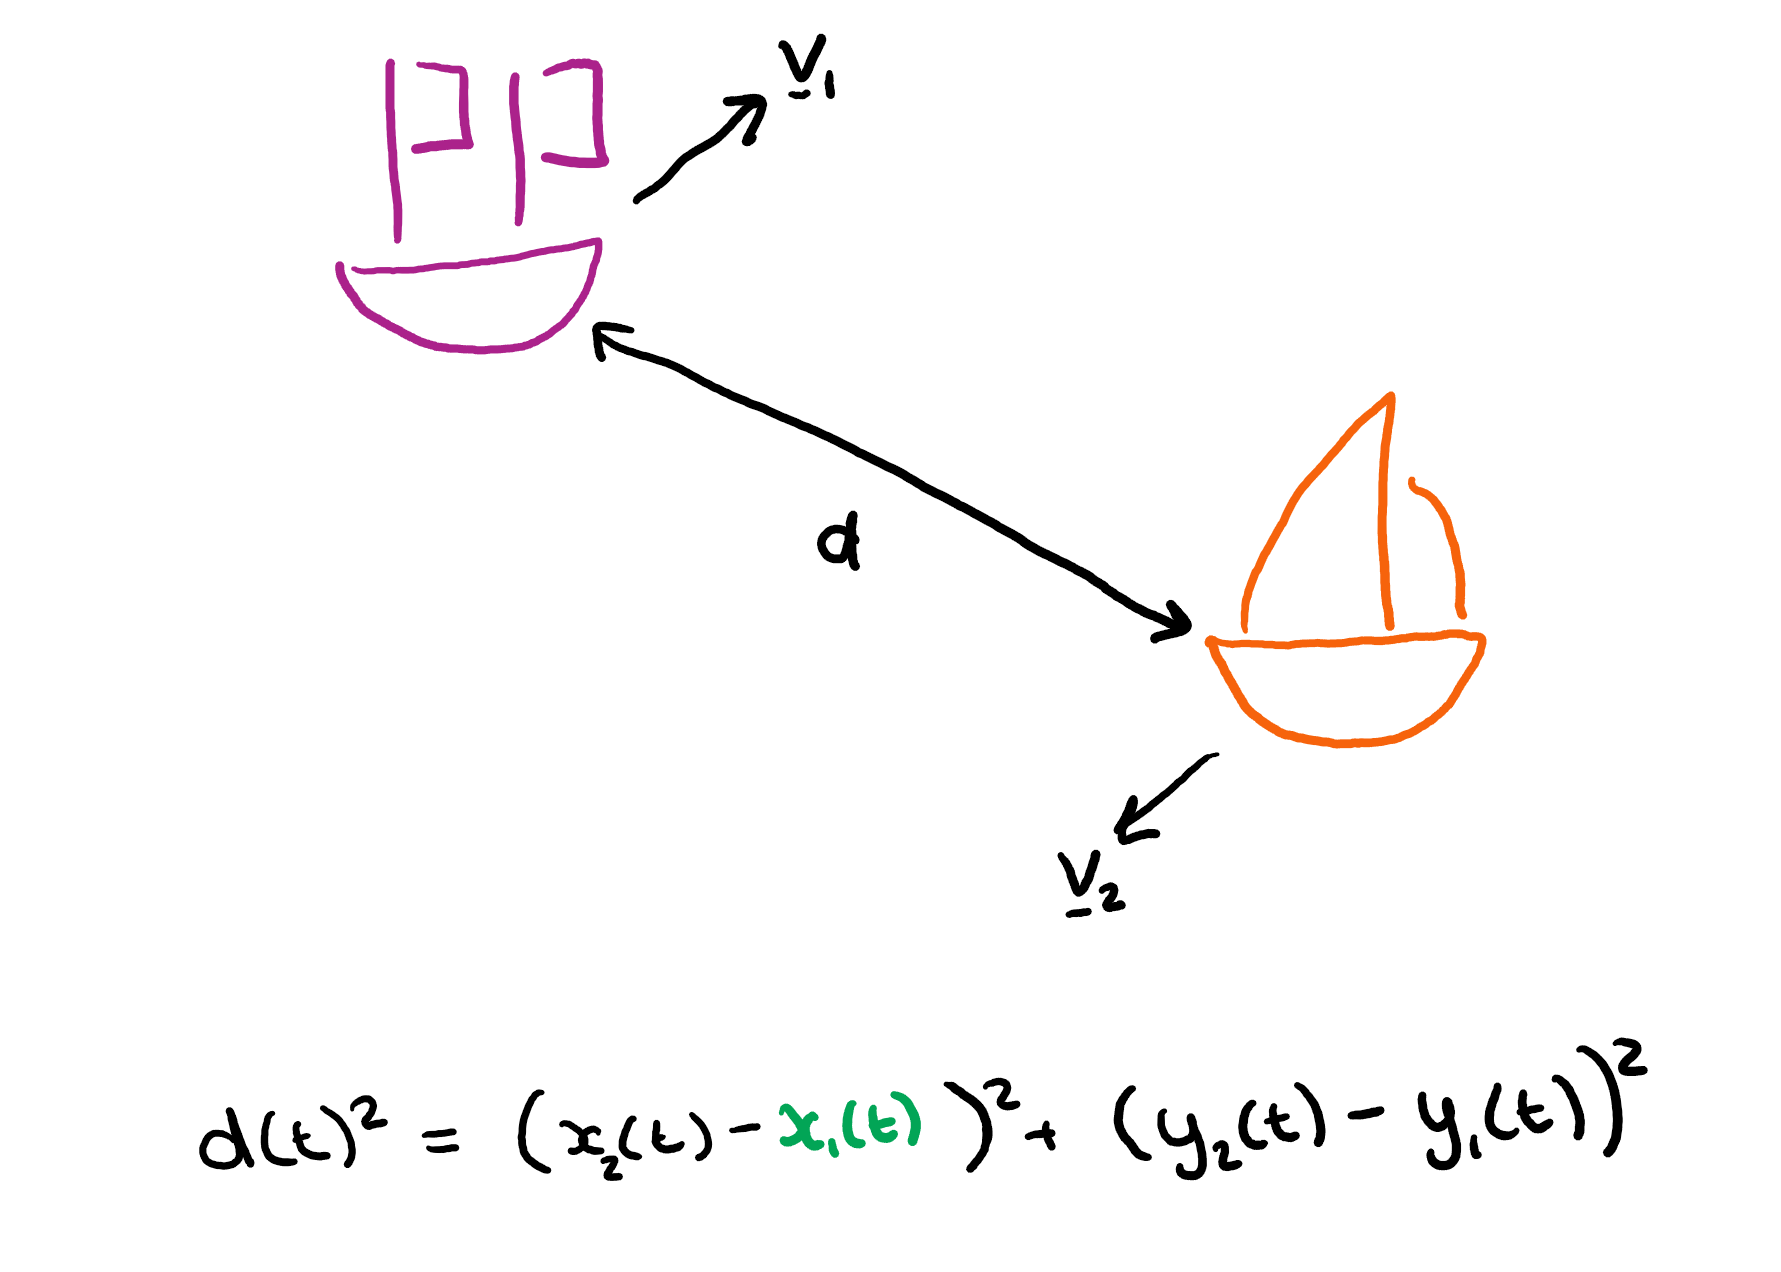
So we can just substitute in the equations for position and velocity and get a quadratic equation to solve for time (which I won't write out here as it's rather large). By solving this equation we can calculate the times at which two vessels are at a certain distance from one another. We can therefore work out the times at which the vessels entered into and then left the contact distance (if they did at all).
We had now proved that it was possible to do the analysis we needed to do using C#. However we now had another problem. Comparing every vessel to every other vessel globally is incredibly expensive. With each vessel checking in about every 2 minutes, this equates to over 3 million comparisons every second. We needed a way to reduce the amount of comparisons we needed to do by quickly finding likely candidates for proximity events.
RTrees
Whilst researching spatial algorithms we came across a paper about RTrees. This research was an important step in the development of a proof of concept - if there are existing technologies which can solve or at least help solve your challenges, why not use them!
RTrees are data structure for storing and indexing spatial data.
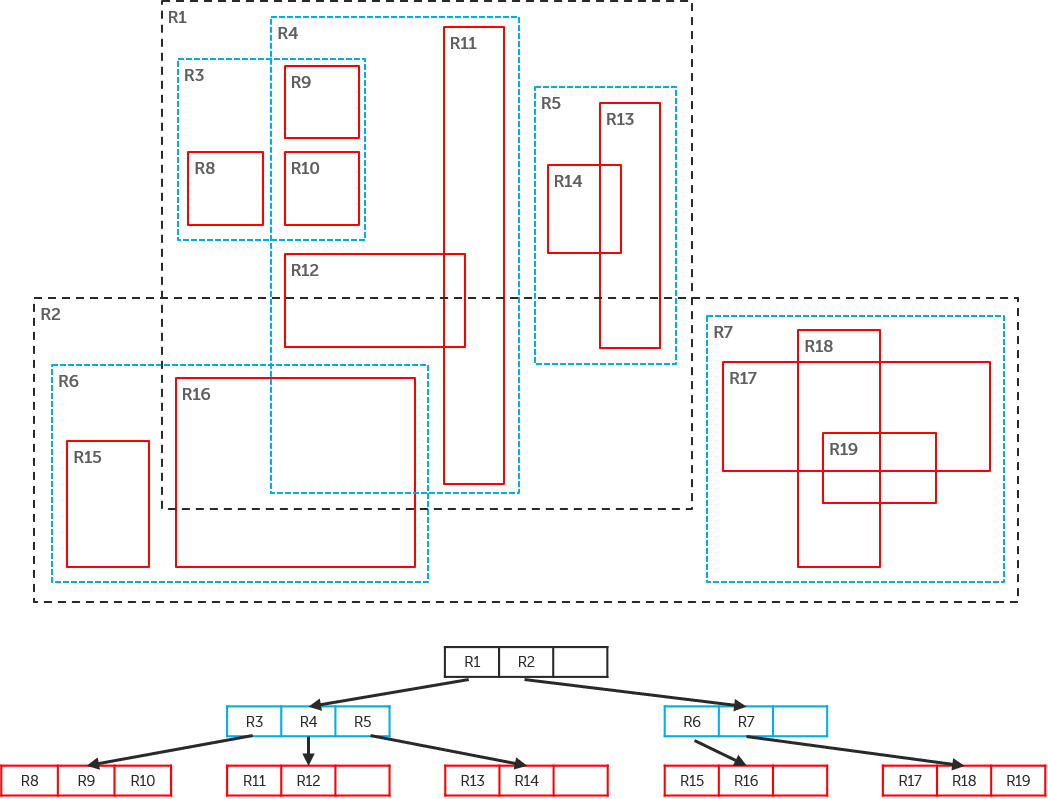
For our analysis, we found the bounding box for each segment of vessel track and stored them in a structure like the one shown here. We could then quickly find overlapping bounding boxes by focusing in on different sections of the tree. This meant that we could quickly find segments of vessel track which were near to one another and therefore candidates for proximity analysis.
If you want to know more about RTrees, the paper we used is here.
So we had a way to find candidates and then process those candidates using the proposed technologies. Now, we have hypothesised that we could use Azure Data Lake (which has support for fine grained security and is also an incredible cheap storage solution) for the processing. We first carried out an analysis to prove that the cost of this storage was within the budget constraints of the project. Once we had proved this, we needed to make sure that it provided enough features to support the analysis we needed to carry out.
Azure Data Lake does not have the same support for multi-index storage that we would have in more sophisticated database engines. We therefore had to find a way to quickly be able to access the data we needed. In this there is an opportunity to design a storage solution which is uniquely optimised for the processing you need to do.
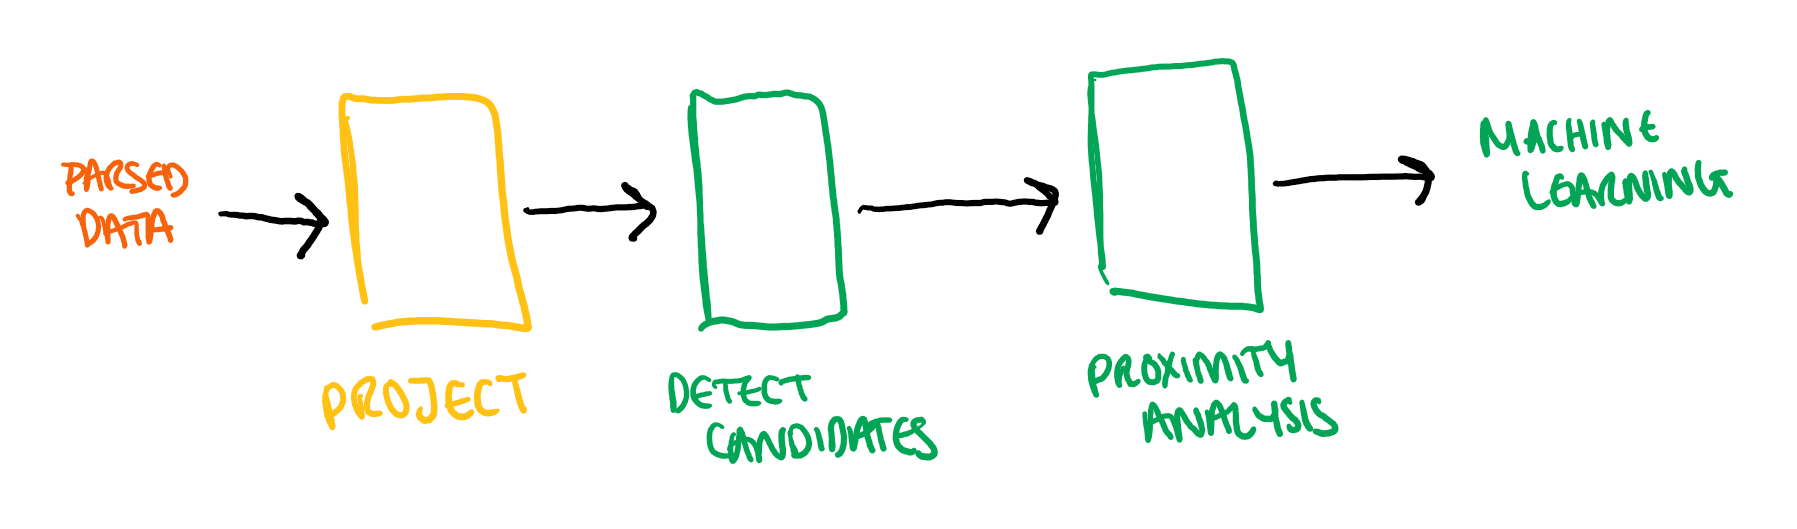
Data projections
If you have done much work around data analysis you may be familiar with the concept of data projections. Data projections are a representation of the data in a form which is useful for the processing you want to perform. In Azure Data Lake, this meant storing the data in a folder structure which meant we could easily find the data we needed. Within each file in the Data Lake, the data was then stored in a way that meant we could quickly and efficiently read out the data structures we needed.
So in our example we need to quickly be able to read out the track for each vessel, and then store each segment of these tracks in the RTree for comparison with other segments. The easiest structure for reading out this data is to first sort the file by vessel ID, and then for each vessel sort the points by timestamp. These files are also partitioned by timestamp, so that the vessel tracks will only be compared to those in the same time frame.
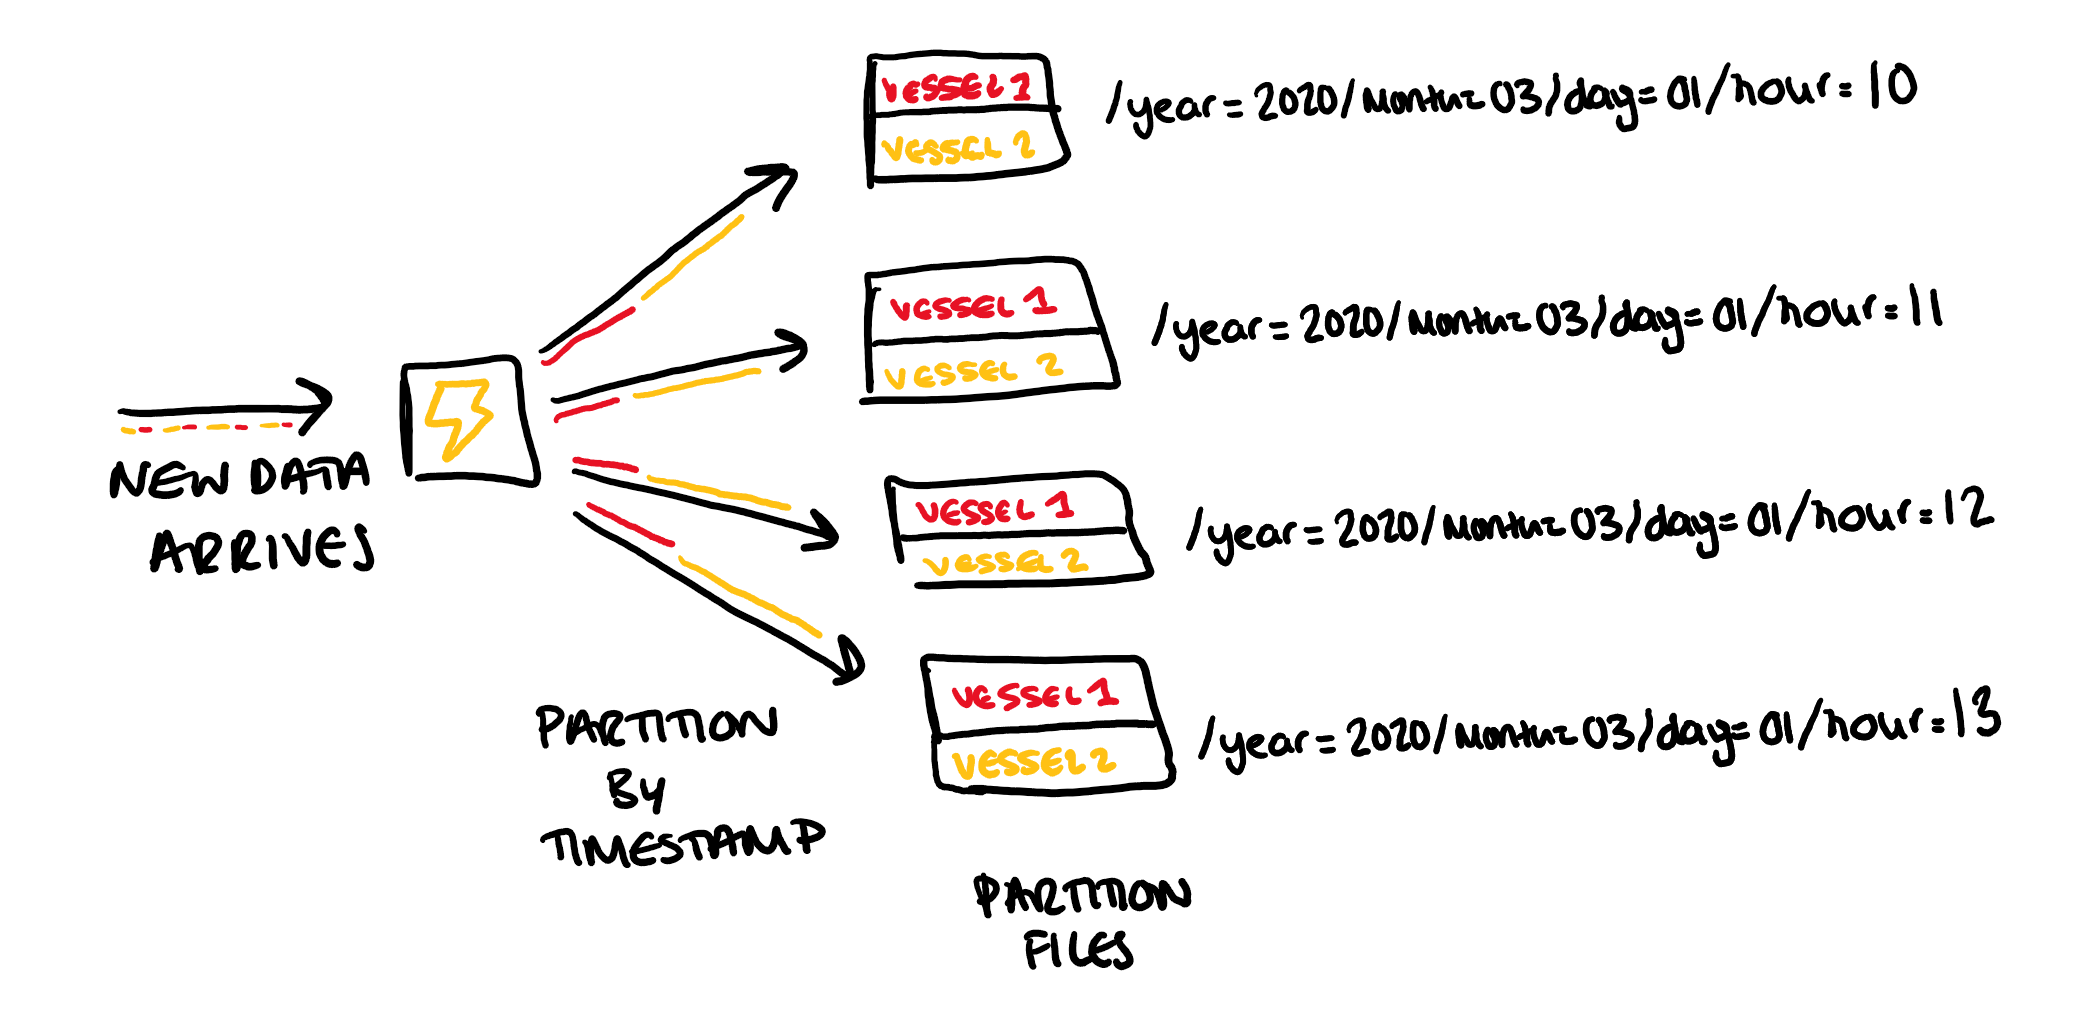
So when new data arrives it will first be split up into the date partitions, so that it is added to the correct file. Then within each partition the data will first be sorted by timestamp and then by vessel ID so in the simple example here, the first half of the file would be vessel 1's track and the second would be vessel 2's.
Organising the files in this way means that we can quickly build up the track for each vessel from the file.
Getting the data into this format is called projecting the data. If we need a different organisation of data for a different analysis, then we can create a second projection of the data. This is made possible because of the fact we are using an extremely low-cost storage option. This is essentially indexing the data in multiple ways, but without paying premium price for multi-index storage.
We measured the speed at which we could read the data out of the files and into the RTrees and found that it was well within the required performance constraints.
Orchestration
So we have almost proved out all of the steps in the processing in order to be able to confirm the approach. The overall process (taking us from raw data through to fishing alerts) looked something like this:
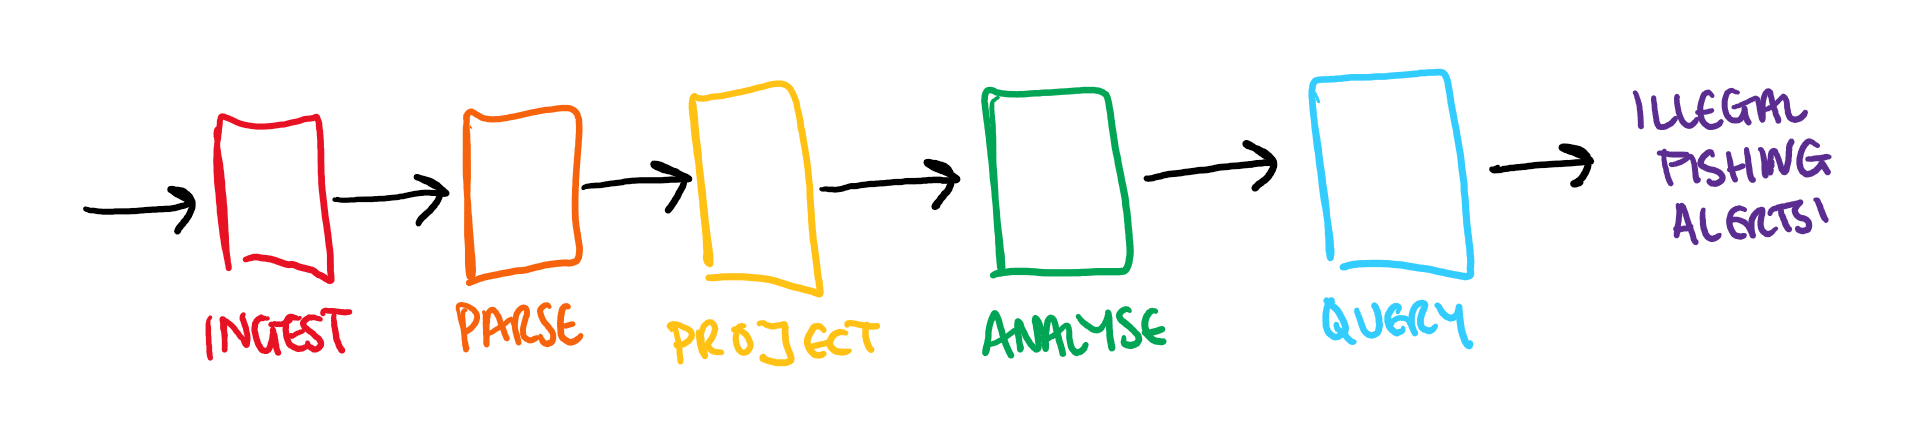
But here we have just been focusing on the central stages:
Here we have a multi-stage pipeline which we need to orchestrate in some way in order to be able to prove that, will all of these steps in place, the system will meet our success criteria.
This is where Durable Functions came in. Durable functions are an extension of regular functions which allow for stateful orchestration of processing. We do this through calling asynchronous operations for each step of the processing and orchestrating these via a durable function. This involves storing state as the processing progresses in order to enable the processing to continue after the host restarts.
Using this stateful processing, we were able to orchestrate pipeline, calling out to asynchronous tasks for each step in the process.
Durable functions also gives you the ability to control the parallelisation within the system. If processing can be parallelised, we can fan this out to happen over multiple function instances, and resources can be allocated as they are needed. Once the processing has finished, if these results need to be aggregated, we can fan back in by waiting for all the tasks to complete. Resources are allocated and deallocated as necessary.
In our system this would look something like this:
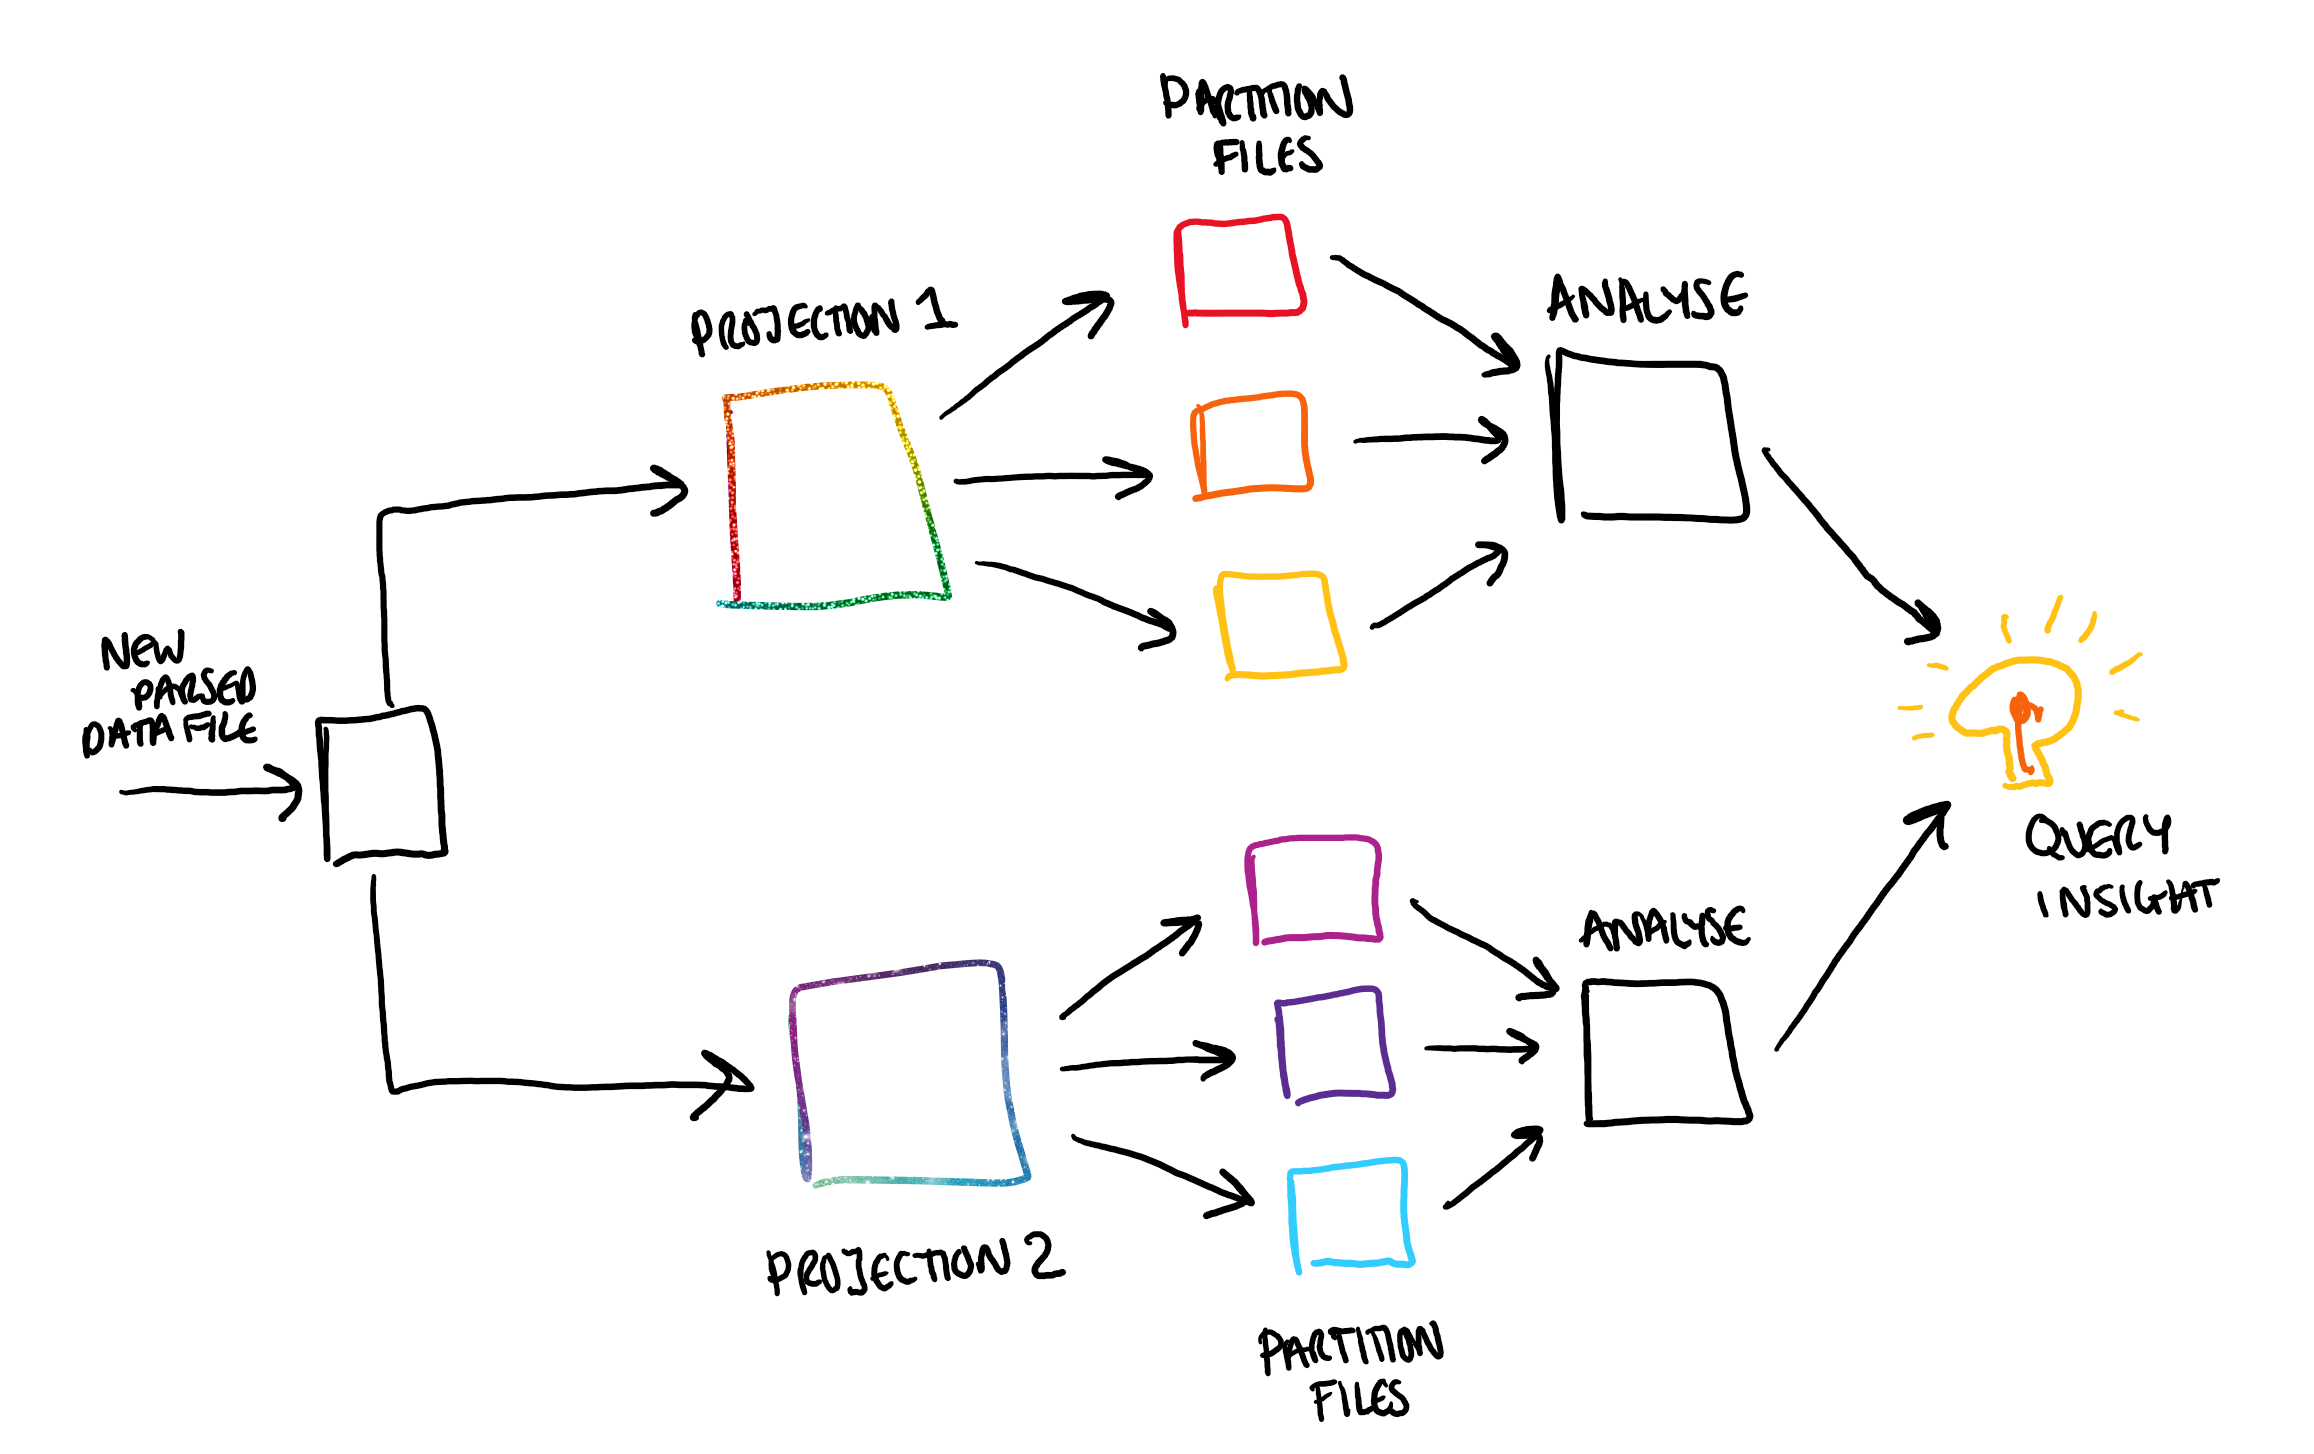
If we had multiple projections, these would be independent and can therefore be processed in parallel. Within each projection the file for each partition are also independent so can also be analysed in parallel with one another. Fanning out in order to carry out this processing can greatly increase the efficiency of processing. Once this processing has been carried out, we can then fan back in in order to perform the analysis and then query the results to gain the insight we need.
In these ways we can build up complex processing that would otherwise be difficult to orchestrate.
Optimisation and benchmarking
Now that we have established that the processing we needed to do was indeed possible using the technologies we proposed, we needed to check that we were meeting the success criteria around performance and budget.
To do this we needed to be able to benchmark the system. We wanted to automate this process so that the measurement could be fully integrated with the change management within the solution. To achieve this we built a small tool which used Application Insights to monitor the running of the orchestration in Azure which could be used to measure the impact of any change made.
With this in place we could then start optimising the system for a serverless environment. There are constraints in Azure Functions around memory usage, and the cost is based on both time of processing and memory used in that time. This meant we to reduce the time spent on processing and the memory consumed. I have written another blog which goes into the details of exactly what we did to optimise the solution in this way. But this process involved a structured method of making a change and then assessing the impact of the change using the benchmarking tool.
Conclusions
Having carried out this proof of concept we were ready to draw our conclusions. For this we go back to our success criteria.
We can process 2000 events/sec
Using our benchmarking tool we could quickly measure the performance of the system and prove that we would be able to process the required volumed of data.
We can do this within the budget constraints
Built into the benchmarking tool was a measurement of Functions' Execution Units. These are a measure of the memory that a function is using over time and are directly linked to the cost of that function. Using these we could quickly calculate the cost of running our processing.
We measured the running of the optimised pipeline and found that all of the compute (including creating the projections, creating the RTrees, and running the proximity analysis) could be run for less than £10 / month on Azure Functions' consumption plan. We had also already established that the cost of storing the data in Azure Data Lake was within the budget constraints.
Overall we concluded that our solution met our success criteria!
We then fully wrote up our findings in order to provide a record of all of the decisions and discoveries made. The benchmarking tool could also be used throughout further development of the system to provide confidence in any changes introduced.
This pattern of validating any proposed approach, with clear assessment points throughout the process, is one which I think should be applied to any software development. We found that our proposed architecture was one which would fit the needs of the system. However, there were many points along the way at which, had we found that the system wasn't going to meet our requirements, we could have made the decision to change that approach (an example would be our initial proposal to use CosmosDB and its geospatial support, before proving that this solution would have been prohibitively expensive).
In this way this structured process limits the time spent exploring dead ends and gives you the confidence you need in order to design complex systems, whilst always keeping the requirements and constraints in mind.