Writing structured data to SharePoint from Synapse Notebooks


In the previous post in this series, I described how to authenticate and query files in SharePoint using Python code running in a PySpark Notebook. The process is similar to how I'd described it using Synapse Pipelines, but rather than using Web Activities, we're just making HTTP requests to the Microsoft Graph API.
The Download URL metadata property that's returned from the Graph API is incredibly useful in both approaches, as it provides a pre-authorised URL that's valid for 1 hour. This means any subsequent requests don't need to be authenticated to use it, so it can be passed into a Copy Activity inside a pipeline, or a Pandas read_csv, to create a dataframe inside a Notebook.
However, when it comes to writing files and data back into SharePoint we don't have an equivalent option. This means that the pipeline-based approach described earlier in this series isn't viable for write scenarios, and we can't use the System Assigned Managed Identity authentication option with HTTP Linked Services.
So, this post describes how to write data into SharePoint from Synapse Notebooks, using a very similar process to how we read files and data.

Authentication and SharePoint Drive ID
The process starts the same way as before - we need to authenticate against the Microsoft Graph API using a Service Principal to retrieve a bearer token. Once we have that, we make a call to the drives endpoint to retrieve the Drive ID of the SharePoint site that we care about.
I included code samples for these steps in the previous post so, rather than repeat them here, I suggest you refer to that to get going.
Building the data payload
Once we have the bearer token and the Drive ID we can continue. The difference between reading and writing data is that this time we actually need to prepare the data that we want to write. Typically (as we're working in a Spark Notebook) we're going to be dealing with tabular structured data, so the most obvious way to do this is to convert the your data to CSV via a Pandas dataframe.
When we're passing the payload to SharePoint, we need it to be a byte array, and that's pretty easy to do using the following code:
file_content = bytes(df.to_csv(lineterminator='\r\n', index=False), encoding='utf-8')
Note - I'm specifying the Windows line endings as Pandas defaults to the Unix/Linux \n. And we don't want the DataFrame's index in the CSV output.
Writing data to files
Now that we've got the data payload, we can send all of that over to SharePoint. Because we don't have a pre-authenticated URL like we did for reading, we need to pass the same authentication headers in all subsequent requests. These are the same headers that we used to retrieve the Drive ID in a previous step.
Piecing all of that together, your code would look something like this:
file_name = "your-file-name.csv"

headers = {
    "Accept": "application/json",
    "Content-Type": "application/json; charset=utf-8",
    "Authorization": f"Bearer {token}"
}

url = f"https://graph.microsoft.com/v1.0/drives/{drive_id}/items/root:/{file_name}:/content"

response = requests.put(url, headers=headers, data=file_content)
response.raise_for_status()

return response.json()["webUrl"]
What else?
The examples above show a typical requirement, which results in writing out tabular data to a CSV file in a SharePoint folder. But, we're not limited to that - as all we're doing is sending a data payload (as a byte array), we could write any kind of content to any kind of file.
Rendering chart visuals to .png and writing to SharePoint
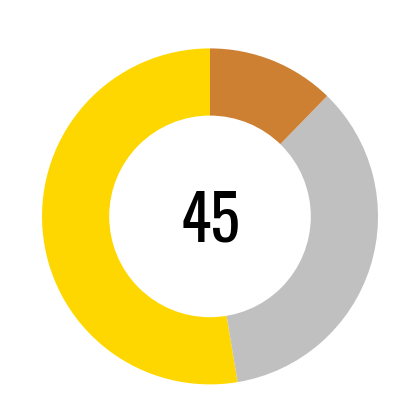
For example, your structured data might be used to create a chart visual using a library like matplotlib, which is installed on the Synapse Spark Pool clusters by default. Here's an example that creates a Power BI-looking donut chart with some sample data. Once the plot is created it's "saved" to an in-memory bytes buffer so it can later be used as a data payload.
import io
import base64
import matplotlib.pyplot as plt

# Sample data
sizes = [30, 20, 7]
colors = ['#ffd700', '#C0C0C0', '#CD7F32']

# Create donut plot
fig, ax = plt.subplots()
ax.pie(sizes, colors=colors, startangle=90)
ax.axis('equal')  # Equal aspect ratio ensures that pie is drawn as a circle

# Add a circle at the center to create a donut effect
center_circle = plt.Circle((0, 0), 0.60, fc='white')
ax.add_artist(center_circle)

plt.annotate(f'45', xy=(0, -0.15), fontsize=45, ha='center')

# Create a BytesIO object and save the plot to it
buf = io.BytesIO()
plt.savefig(buf, format='png')
buf.seek(0)

# Read the buffer
image_data = buf.read()

# Close the buffer
buf.close()

# Display the plot
plt.show()
Following the same process above, this payload can be sent to SharePoint via the Graph API.
If we set the file extension in the file_name variable to .png, and pass the image_data payload as the contents of the file, the only difference to saving the CSV file is that the Content-Type header needs to change to Content-Type": "application/octet-stream". This now means we can create this visual as an image file directly in SharePoint!
We've applied similar approaches to these in our data platform projects to dynamically create rich reporting outputs when Power BI isn't the answer - e.g. embedding text, data, and visuals in Word documents using the excellent python-docx-template library.
Summary
Whilst writing data to files in SharePoint is a very common requirement in most of the data projects we deliver, there's no out-the-box support inside Synapse. This post and the code samples within demonstrate how to authenticate and write files using Python code running in a PySpark Notebook.
In the few next posts, I'll take what we've learned so far and start translating the same requirements in to Microsoft Fabric.