Carbon Optimised Data Pipelines - minimise CO2 emissions through intelligent scheduling (Pipeline Definition)

In the first post in this series, I described how the carbon footprint of long running data pipelines can be optimised using open source data APIs like the Carbon Intensity forecast from the National Grid ESO. In the second post in this series, I then translated the conceptual approach into a modern data pipeline architecture using a cloud native analytics platform like Microsoft Fabric or Azure Synapse.
In this post I'll go into more detail, describe the pipeline definition in detail and provide a full code sample for you to use in your own workloads. It's worth saying that the entire solution that I describe can be lifted and shifted into an Azure Data Factory pipeline, Synapse Pipelines, or a Fabric Data Factory pipeline. There are, of course, other ways to achieve the same behaviour - different options for compute or programmatic logic that might be more applicable, or appropriate for you to implement. But, I took a deliberate decision to model the end to end process in a pipeline definition, using out-the-box activities for the processing logic for ease of re-use and portability.
Carbon optimised pipeline runner
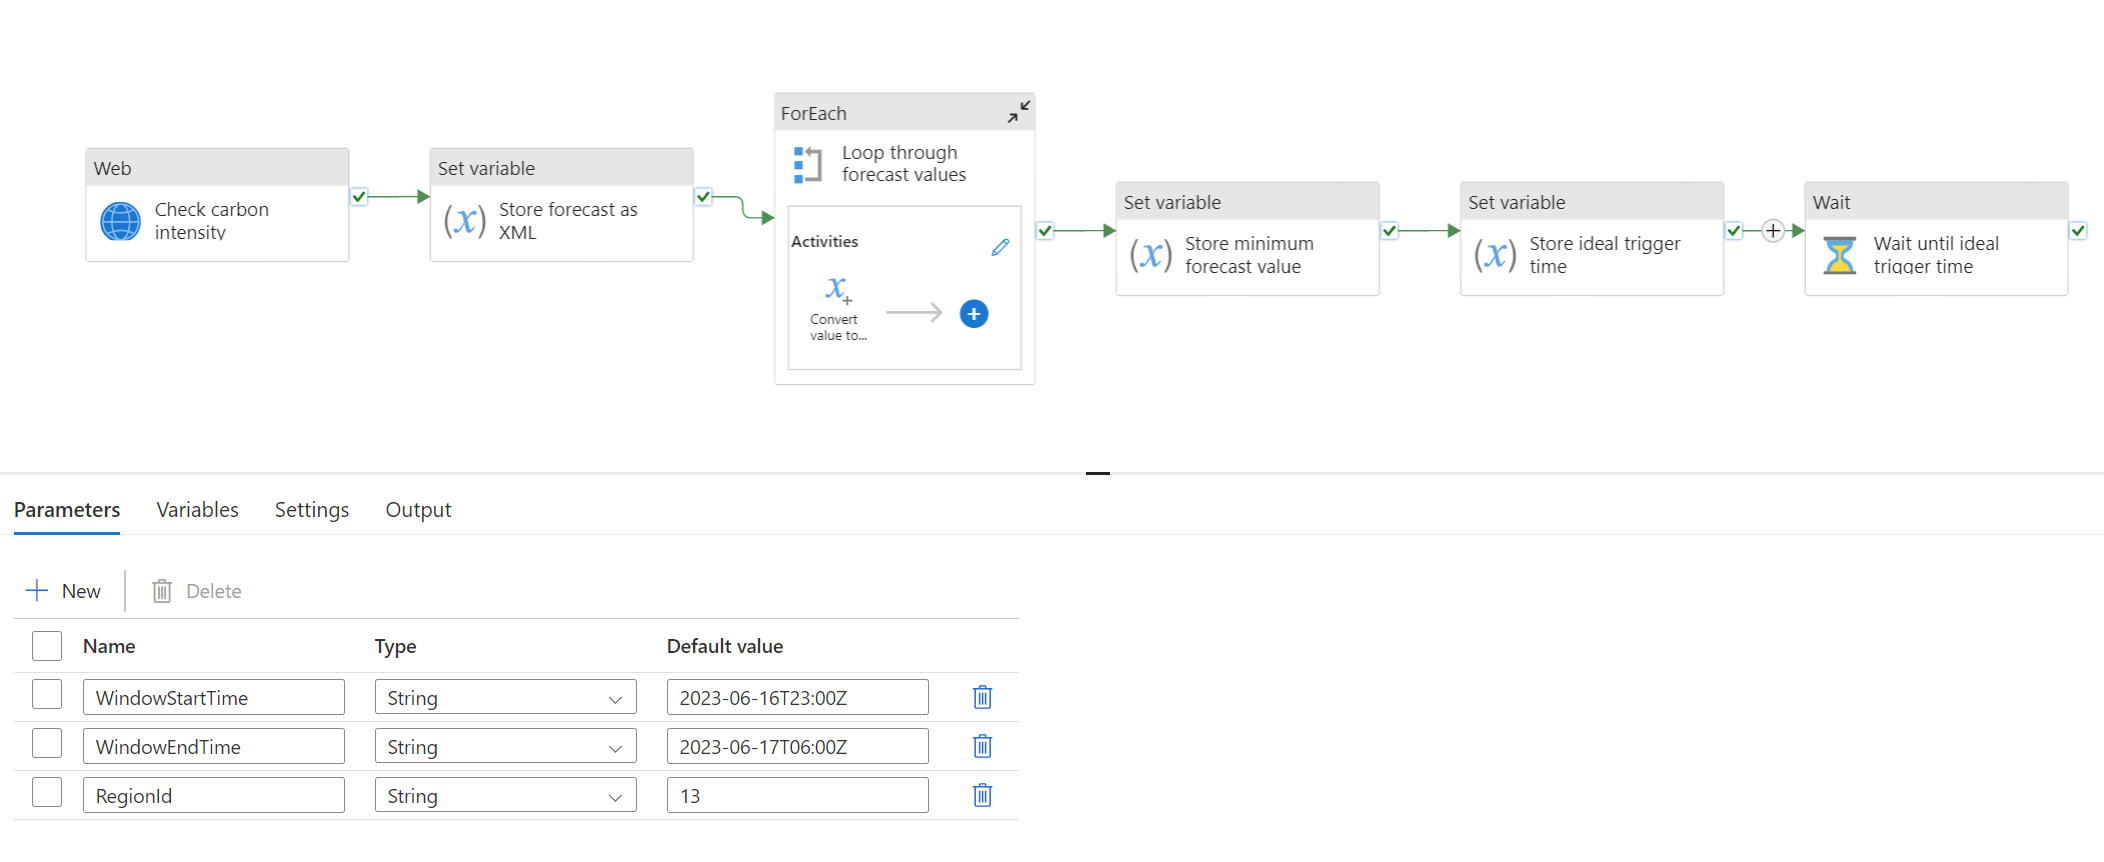
At the heart of the solution is the pipeline that calculates the optimum scheduling time for your workload pipeline.
Check carbon intensity
The first step in this process is a web activity that calls the Carbon Intensity forecast API, using the pipeline parameters to construct the right query:
{
    "name": "Check carbon intensity",
    "type": "WebActivity",
    "dependsOn": [],
    "policy": {
        "timeout": "0.12:00:00",
        "retry": 0,
        "retryIntervalInSeconds": 30,
        "secureOutput": false,
        "secureInput": false
    },
    "userProperties": [],
    "typeProperties": {
        "method": "GET",
        "url": {
            "value": "https://api.carbonintensity.org.uk/regional/intensity/@{pipeline().parameters.WindowStartTime}/@{pipeline().parameters.WindowEndTime}/regionid/@{pipeline().parameters.RegionId}",
            "type": "Expression"
        },
        "connectVia": {
            "referenceName": "AutoResolveIntegrationRuntime",
            "type": "IntegrationRuntimeReference"
        }
    }
}
This API response will provide the carbon intensity forecast for the deployment region within the specified time window that we have to run our workload.
The following activities parse the response in order to obtain the optimum trigger time.
Store forecast as XML
XML might not be your first choice for modelling this data, especially as the data is initially being returned as JSON. However, you'll see in subsequent steps that we're going to use XPATH selectors to parse the data, which allows us to do querying over the data without needing to call out to code (which would need to run somewhere). Using XML/XPATH means we can model the whole process with out-the-box activities in the pipeline. However, parsing support in Azure Data Factory for both XML and JSON is a bit limited and can be complicated. The JSON response that we get from the Carbon Intensity Forecast API needs some massaging, so this activity constructs a simpler JSON object with the output data that we care about, then converts it to XML and stores it in a variable for subsequent processing:
{
    "name": "Store forecast as XML",
    "type": "SetVariable",
    "dependsOn": [
        {
            "activity": "Check carbon intensity",
            "dependencyConditions": [
                "Succeeded"
            ]
        }
    ],
    "policy": {
        "secureOutput": false,
        "secureInput": false
    },
    "userProperties": [],
    "typeProperties": {
        "variableName": "Forecast XML",
        "value": {
            "value": "@string(xml(json(concat('{\"forecast\":{\"data\":', activity('Check carbon intensity').output.data.data,'}}'))))",
            "type": "Expression"
        }
    }
}
Loop through forecast values
Now that we have a valid XML structure stored in a variable, the next activity selects all of the forecast values using an XPATH query and converts each of them to an integer value. It then appends each value to an array variable so that we can do some comparisons.
{
    "name": "Loop through forecast values",
    "type": "ForEach",
    "dependsOn": [
        {
            "activity": "Store forecast as XML",
            "dependencyConditions": [
                "Succeeded"
            ]
        }
    ],
    "userProperties": [],
    "typeProperties": {
        "items": {
            "value": "@xpath(xml(variables('Forecast XML')), '//data/intensity/forecast/text()')",
            "type": "Expression"
        },
        "isSequential": false,
        "activities": [
            {
                "name": "Convert value to numeric",
                "type": "AppendVariable",
                "dependsOn": [],
                "userProperties": [],
                "typeProperties": {
                    "variableName": "Forecast values",
                    "value": {
                        "value": "@int(item())",
                        "type": "Expression"
                    }
                }
            }
        ]
    }
}
Store minimum forecast value
Now that we have an array of forecast values (as integers), the next activity can do a simple min() function to find the lowest value and store that in a variable - this is the lowest carbon intensity prediction from our API response, so when the forecast hits this point, that's when we want to trigger our workload pipeline.
{
    "name": "Store minimum forecast value",
    "type": "SetVariable",
    "dependsOn": [
        {
            "activity": "Loop through forecast values",
            "dependencyConditions": [
                "Succeeded"
            ]
        }
    ],
    "policy": {
        "secureOutput": false,
        "secureInput": false
    },
    "userProperties": [],
    "typeProperties": {
        "variableName": "Minimum forecast value",
        "value": {
            "value": "@string(min(variables('Forecast values')))",
            "type": "Expression"
        }
    }
}
Store ideal trigger time
We can then use the lowest carbon intensity value to find the associated time in the forecast using another XPATH expression and store that in another variable as our ideal trigger time. If there's more than one time period with the same lowest forecast value, then this XPATH will just return the first one, so that's when we'll trigger the workload.
{
    "name": "Store ideal trigger time",
    "type": "SetVariable",
    "dependsOn": [
        {
            "activity": "Store minimum forecast value",
            "dependencyConditions": [
                "Succeeded"
            ]
        }
    ],
    "policy": {
        "secureOutput": false,
        "secureInput": false
    },
    "userProperties": [],
    "typeProperties": {
        "variableName": "Trigger time",
        "value": {
            "value": "@string(xpath(xml(variables('Forecast XML')), concat('string(//data/from[../intensity/forecast =',  variables('Minimum forecast value'),'])')))",
            "type": "Expression"
        }
    }
}
Wait until ideal trigger time
And finally, now that we've extracted the ideal trigger time, we can use that to calculate the timespan between now and then and just wait until we're ready to trigger the workload. This is a pretty simple solution to the scheduling - and of course there are other options or approaches for how to do this. But with Data Factory already having this polling/waiting functionality built-in, this provides the most lightweight/portable solution to the problem.
More sophisticated approaches could use queues, or metadata/config driven scenarios to control the dynamic scheduling once you have the ideal trigger time, but ultimately under the covers there's still going to be some form of polling going on somewhere, even if it's abstracted away from you.
{
    "name": "Wait until ideal trigger time",
    "type": "Wait",
    "dependsOn": [
        {
            "activity": "Store ideal trigger time",
            "dependencyConditions": [
                "Succeeded"
            ]
        }
    ],
    "userProperties": [],
    "typeProperties": {
        "waitTimeInSeconds": {
            "value": "@div(sub(ticks(variables('Trigger time')),ticks(utcnow())),10000000)",
            "type": "Expression"
        }
    }
}
Trigger Workload pipeline
The other part of the solution is the pipeline that wraps the end to end process - calling the optimisation pipeline described above, and then the long running workload pipeline once we've decided when to trigger it.
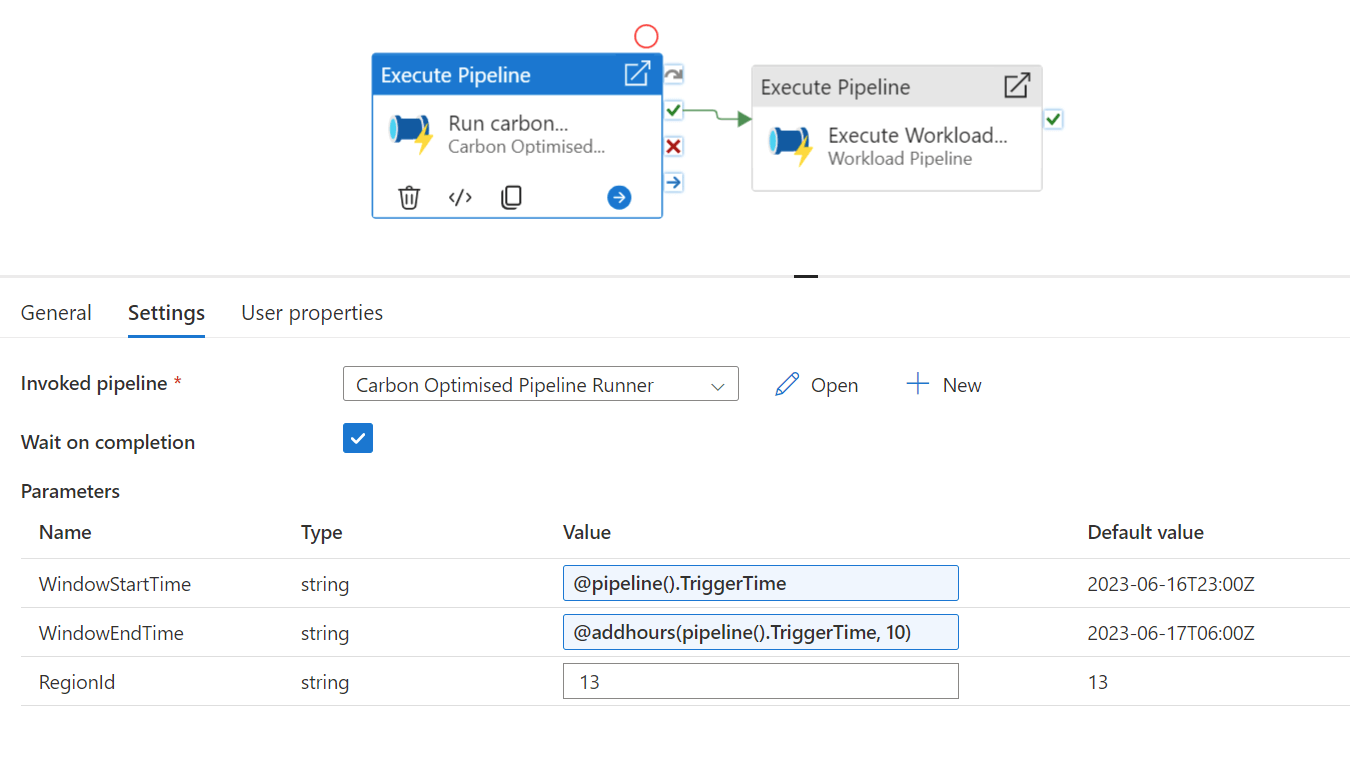
This pipeline is a lot simpler - it's just two activities:
Run carbon optimiser
The first step uses an ExecutePipeline activity to call into the optimisation pipeline with the associated metadata about the workload. Remember, this pipeline will calculate the optimum trigger time and then halt execution until that time comes.
{
    "name": "Run carbon optimiser",
    "type": "ExecutePipeline",
    "dependsOn": [],
    "policy": {
        "secureInput": false
    },
    "userProperties": [],
    "typeProperties": {
        "pipeline": {
            "referenceName": "Carbon Optimised Pipeline Runner",
            "type": "PipelineReference"
        },
        "waitOnCompletion": true,
        "parameters": {
            "WindowStartTime": {
                "value": "@pipeline().TriggerTime",
                "type": "Expression"
            },
            "WindowEndTime": {
                "value": "@addhours(pipeline().TriggerTime, 10)",
                "type": "Expression"
            },
            "RegionId": "13"
        }
    }
}
Execute workload pipeline
The second step simply calls into our workload pipeline using another ExecutePipeline activity. As this activity depends on the successful completion of the previous step, it won't fire until the optimisation pipeline has succeeded, which means it's now the ideal time to trigger the long running process.
{
    "name": "Execute Workload Pipeline",
    "type": "ExecutePipeline",
    "dependsOn": [
        {
            "activity": "Run carbon optimiser",
            "dependencyConditions": [
                "Succeeded"
            ]
        }
    ],
    "policy": {
        "secureInput": false
    },
    "userProperties": [],
    "typeProperties": {
        "pipeline": {
            "referenceName": "Workload Pipeline",
            "type": "PipelineReference"
        },
        "waitOnCompletion": true
    }
}
Workload pipeline
The third and final part of the solution is the workload pipeline, for which I haven't provided an example as this will be entirely dependent on what your long-running ETL process is. If it's structured as a separate pipeline, then the Trigger Workload Pipeline described above can just execute it when it's ready.
Full code samples
As well as breaking down the activity steps in this post, I've extracted and provided full pipeline definitions as Github gists which can be found here:
Carbon Optimised Pipeline Runner definition
Trigger Workload Pipeline definition
You should be able to add these directly to your solutions, whether you're using Azure Data Factory, Fabric, or Synapse.
Conclusion
Over a series of three posts, we've gone from introducing a concept, to describing how it would fit within a modern cloud architecture, to making it real within Azure Data Factory-based pipelines (including Synapse or Fabric). The codebase that's shared in this post is by no means the only way to do it, but it illustrates that it's definitely possible to design intelligent, carbon-aware scheduling of your long-running cloud processes and gives you a starting point to develop further or modify according to the specifics of your own requirements.
In the next and final post I'll explore some ideas about how the sample above could be extended or improved!

