Introduction to Python Logging in Synapse Notebooks
Notebooks are an incredibly flexible and useful part of Synapse (and other similar data platforms). They are great for getting started with exploring new datasets, as well as providing maximum flexibility when processing and analyzing data. As a result, it's quite common for a notebook to evolve from that initial exploratory code to be part of a productionised data processing pipeline.
During the process of productionisation, it's necessary to ensure that errors in production can be effectively diagnosed. Depending on the complexity of the notebook, this might be simple - if it fails, you can head into Synapse Studio, look at the pipeline run and examine the state of the notebook. For more complex notebooks, or scenarios where you may need to look at logs outside Synapse Studio, you will need to think about how you can improve the observability of your code - specifically, how you can understand the internal state of your code at the point of failure, which will help you reason about the ultimate cause of that failure.
The first step on that road is basic logging - writing out additional data about the execution of your code, and ensuring that information is captured in a way that you can easily look at later. In this post we take a look at how you can use Python's built in support for logging inside a notebook in Synapse.
Basic Python logging using the logging module
Python provides the logging module which allows you to create and use logger objects to store messages.
All log messages have a severity associated with them; the levels (from least to most severe) are:
DEBUGINFOWARNINGERRORCRITICAL
When using the logging module, you can either create specific loggers or use the default logger. This code demonstrates use of the default logger:
import logging

logging.debug('This is a debug message')
logging.info('This is an info message')
logging.warning('This is a warning message')
logging.error('This is an error message')
logging.critical('This is a critical message')
When run in a Python notebook in Synapse, these log messages appear in the cell output.

They also appear in the output from the Apache Spark application. To see this, go to the "Monitor" tab,

As you can see, although we had five lines of code that called the logger to record a message, we only saw three in both the cell and Spark application output. Why is this?
Log levels
As mentioned above, there are five severity levels you can use when logging messages. As we saw in the previous example, only the messages logged using logging.warning, logging.error and logging.critical ended up in the cell and Spark output. All loggers, including the default one, have a severity level set and by default, it is WARNING. This means that only messages of level WARNING and above will be logged.
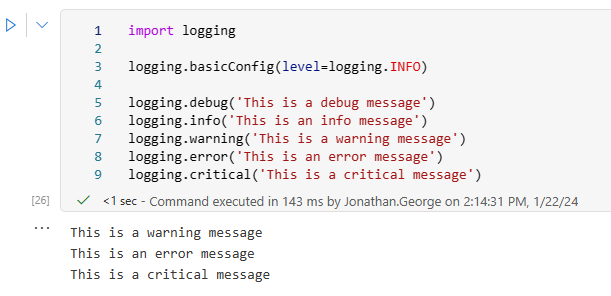
To alter this for the default logger, a standard Python program would be able to call the logging module's basicConfig method, as shown in the following code:
import logging

logging.basicConfig(level=logging.INFO)

logging.debug('This is a debug message')
logging.info('This is an info message')
logging.warning('This is a warning message')
logging.error('This is an error message')
logging.critical('This is a critical message')
However, this does not work as expected in the Synapse environment. We would have expected to see the message from logging.info, but instead we only see the same three as before:
The reason for this is that the runtime has already made the call to basicConfig, which means subsequent calls are ignored, as per the documentation:
This function does nothing if the root logger already has handlers configured, unless the keyword argument
forceis set to True.
We don't want to use the force argument because this has the effect of removing any existing handlers attached to the root logger. If we inspect the root logger, as configured by the runtime, we see that it has a handler in place already, but forcing new basic configuration has the effect of replacing it with a different type of handler.
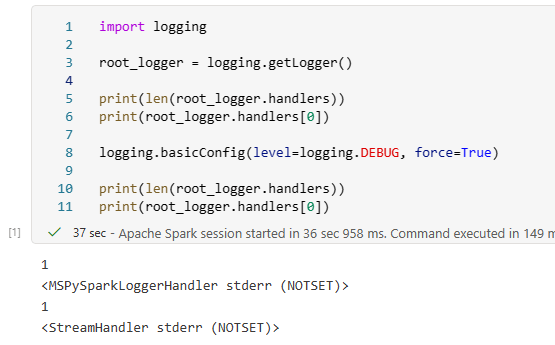
Prior to our call to basicConfig with force=True, the default logger instance had been configured with a single handler of type MSPySparkLoggerHandler. After we called basicConfig, it had been removed and replaced with the default StreamHandler.
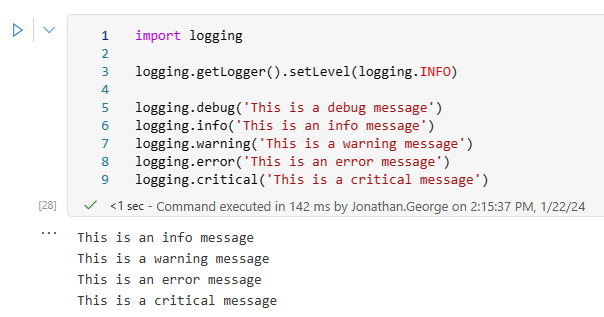
However, it's still possible to modify the log level of the default logger by obtaining its instance using getLogger():
import logging

logging.getLogger().setLevel(logging.INFO)

logging.debug('This is a debug message')
logging.info('This is an info message')
logging.warning('This is a warning message')
logging.error('This is an error message')
logging.critical('This is a critical message')
The call to logging.getLogger() retrieves the default logger instance, which can then be modified as required. As a result, we now see the info message as well as the other three. As expected, we still don't see the debug level message.
Log level considerations in Synapse
Whilst there may be a good argument for lower the log level of the default logger, I don't recommend using DEBUG as this will result in large amounts of additional output from Spark itself:

Custom loggers
Whilst using the default logger makes it easy to get started, the library also allows you to create custom loggers. Let's have a look at how that works:
import logging

custom_logger = logging.getLogger('basic_logging_custom_logger_example')
custom_logger.setLevel(logging.DEBUG)

logging.debug('This is a debug message')
logging.info('This is an info message')
logging.warning('This is a warning message')
logging.error('This is an error message')
logging.critical('This is a critical message')

custom_logger.debug('This is a debug message from the custom logger')
custom_logger.info('This is an info message from the custom logger')
custom_logger.warning('This is a warning message from the custom logger')
custom_logger.error('This is an error message from the custom logger')
custom_logger.critical('This is a critical message from the custom logger')
In this example, we see that the default logger continues to log at the WARNING level and above, while the custom logger has its level set to DEBUG and logs all the messages.

Custom logger naming in Synapse notebooks
When using custom loggers in standard Python code, a normal approach is to create a custom logger for each module, using the module name for the custom logger name:
module_logger = logging.getLogger(__name__)
This approach doesn't work in a Synapse notebook:

However, we can use the logical equivalent in Synapse: the notebook name. This can be obtained using the following code:
notebook_name = mssparkutils.runtime.context['currentNotebookName']
If you use this when creating the custom logger, you end up with the result you'd expect:

Message formatting
As well as controlling the log level, you can also specify the format in which messages are written. You specify this as a string containing some well-known substitution tokens. You can view the full list here.
For the default logger, this can be set using logging.basicConfig, but this doesn't work in Synapse for the reasons described above. You can still use the same approach using getLogger():
formatter = logging.Formatter('%(asctime)s:%(name)s:%(levelname)s:%(message)s')
logging.getLogger().handlers[0].setFormatter(formatter)

logging.warning("This is a warning message")
This format string adds the timestamp, logger name and log level to the message:

The same approach can be taken with custom loggers. It's also worth noting that custom loggers inherit the settings on the default logger by default.
import logging

custom_logger = logging.getLogger(mssparkutils.runtime.context['currentNotebookName'])

custom_logger.setLevel(logging.INFO)

# The custom logger's handlers collection will be empty by default. To use a custom format,
# we need to have a handler to add it to. Unless otherwise instructed, a StreamHandler will
# write its output to stderr which means we'll see our log messages in the same place as
# those written by the default logger.
custom_handler = logging.StreamHandler()
formatter = logging.Formatter('%(asctime)s:%(name)s:%(levelname)s:%(message)s')
custom_handler.setFormatter(formatter)
custom_logger.addHandler(custom_handler)

custom_logger.debug('This is a debug message')
custom_logger.info('This is an info message')
custom_logger.warning('This is a warning message')
custom_logger.error('This is an error message')
custom_logger.critical('This is a critical message')

Including variables in log messages
It's commonplace when logging to want to include information about the current state of your application, and this often means adding the current values of variables into your code. This could be done using standard Python interpolation - either f-strings or %-formatting, and both would work. However, the logging module provides an additional option, as shown in the following cell:
import logging

some_string = 'some string'
int_1 = 1
int_2 = 2
int_3 = 3

logging.warning('Log message from "%s" with values %i, %i, %i', some_string, int_1, int_2, int_3)
The logged string is the result of applying this interpolation:

On the surface, this looks very much like %-formatting - and it is. The key difference between this and the other two string interpolation methods is when the interpolation takes place.
Here's the above code rewritten to use the other approaches:
import logging

some_string = 'some string'
int_1 = 1
int_2 = 2
int_3 = 3

# 1 - f-string
logging.warning(f'Log message from "{some_string}" with values {int_1}, {int_2}, {int_3}')

# 2 - %-formatting
logging.warning('Log message from "%s" with values %i, %i, %i' %(some_string, int_1, int_2, int_3))

# 3 - logger arguments
logging.warning('Log message from "%s" with values %i, %i, %i', some_string, int_1, int_2, int_3)
On the face of it, the three different methods appear to have had the same outcome:

With the f-string and %-formatting approaches, the string interpolation takes place before the call to logger.warning, and the interpolated string is passed to the method.
With the logger arguments approach, the raw string and arguments are passed to the logger.warning function, and string interpolation only takes place if the message is going to be written out. This means that if you're doing relatively expensive string interpolation in a call to logger.debug, that interpolation will only happen if your log level is set to DEBUG; if it's set any higher, there will be no need for the interpolation to take place.
Logging exceptions
There are a couple of additional options when logging exceptions.
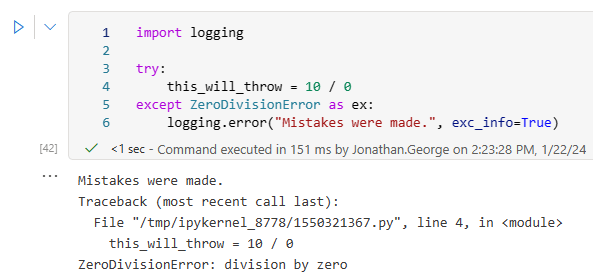
Firstly, stack traces can be added to log messages using the exc_info parameter. This only works if called from an exception handler block:
import logging

try:
    this_will_throw = 10 / 0
except ZeroDivisionError as ex:
    logging.error("Mistakes were made.", exc_info=True)
This results in the log message and call stack being written to the output:
Alternatively, the logger's exception method can be used from the exception handler to achieve the same result:
import logging

try:
    this_will_throw = 10 / 0
except ZeroDivisionError as ex:
    logging.exception("Mistakes were made.")
This has exactly the same result as calling logging.error with the exc_info parameter:

Two final warnings
There are two additional points to be aware of when logging in Synapse notebooks.
The first is applicable to logging in any scenario: when adding variable values or other data to your log messages, take care not to include any sensitive information.
The second is Synapse specific. If your Notebooks is being executed from a Synapse pipeline, be careful not to log too much. Notebook state is captured as part of execution and returned to the pipeline. However, there is a size limit to this data; 8MB. If the size of the notebook and the size of the output generated exceeds this size, you will get an error with the message Size of notebook content and exit value must be less than 8MB. The most likely scenarios that would cause this are displaying dataframes and using logging statements inside loops.
Conclusions and recommendations
Adding custom logging to your notebooks is well worth it; it will allow you to capture valuable additional information about their execution and is simple to do using standard Python logging functionality.
Recommendations:
- Override the default logger message format to include the timestamp and log level, which will make it easier to search logs for your messages.
- Don't set the default logger level any lower the
INFO - Create custom loggers for your notebooks, using the notebook name as the logger name. Again, this will make it easier to find and understand messages.
- When adding variable values to your log messages, use the mechanism provided by the loggers for string interpolation rather than f-string or %-formatting
- Ensure you don't log sensitive data such as access tokens, passwords or personally identifiable information(PII)
- If your notebook is being executed from a Synapse pipeline:
- Avoid logging statements inside loops
- Avoid outputting entire dataframes

