EVALUATEANDLOG in DAX

Jeffrey Wang (the father of DAX) has recently posted a blog entry covering an exciting and extremely useful hidden new feature in DAX - the EVALUATEANDLOG function. EVALUATEANDLOG can be used to print the intermediate result of any part of your DAX expression that returns a scalar value or a table. This helps you to understand how DAX is working "under the hood", and allows you to trace back errors and unexpected results with greater ease.
The release of this function is a real breakthrough, as previous to this, there was no real debugging capability for DAX expressions. It also brings Power BI Desktop closer to being an engineer's tool in its own right.
This blog post will explore the mechanics of EVALUATEANDLOG and understanding the output of the EVALUTEANDLOG function.
Using EVALUATEANDLOG
You can use EVALUATEANDLOG to examine the result calculated by parts of a measure. If we take the following measure:
Total Profit = SUM(Sales[Sales Amount]) - SUM(Sales[Unit Cost])
We can temporarily modify the expression by injecting EVALUATEANDLOG to print the intermediate values of this DAX expression to double check that they are correct. Now you can see the intermediate values of the two SUMs before the subtraction.
Total Profit = EVALUATEANDLOG(SUM(Sales[Sales Amount])) - EVALUATENADLOG(SUM(Sales[Unit Cost]))
Prior to EVALUATEANDLOG, this would have to be achieved manually by temporarily adding the 'Sales Amount' and 'Unit Cost' columns to the report and inspecting the numbers.
It is important to mention here that the EVALUATEANDLOG feature is currently not supported, hence why it was not mentioned by Microsoft in the Power BI August 20222 Feature Summary. Be aware that when you use EVALUATEANDLOG in your DAX expressions today, although the calculation should work just fine, intellisense will not work and a red squiggly line will appear below the function itself. You should also remove the EVALUATEANDLOG function from your expressions before publishing your reports in to Power BI Service.
Mechanics of EVALUATEANDLOG
As we know, EVALUATEANDLOG can be injected around any part of your DAX expression that returns either a scalar value or a table. When the expression is calculated, the intermediate values will be sent, in JSON format, to form the content of the 'TextData' column of a "DAX Evaluation Log". A "DAX Evaluation Log", is an Analysis Services Trace event.
There is currently no native support in Power BI to visualise the output of the EVALUATEANDLOG function. However, Jeffrey Wang has developed an external tool, DAX Debug Output, which is a simple GUI you can use to visualise the output of the EVALUATEANDLOG function. The next part of this blog post will look at examining the output of EVALUATEANDLOG using this tool.
You can download DAX Debug Output here: https://github.com/pbidax/DAXDebugOutput/releases/tag/v0.1.0-beta
Output of the EVALUATEANDLOG function for table expressions
You can wrap the EVALUATEANDLOG function around any table expression to visualise the output. This is powerful as this enables you to visualise all of the intermediate tables that are used within the query. Prior to the release of the EVALUATEANDLOG function, this was not possible, and visualising these intermediate tables was left to the imagination. Now, we can see how DAX is working "under the hood".
For example, we can use EVALUATEANDLOG inside of the COUNTROWS function to visualise exactly which rows are being counted in the expression.
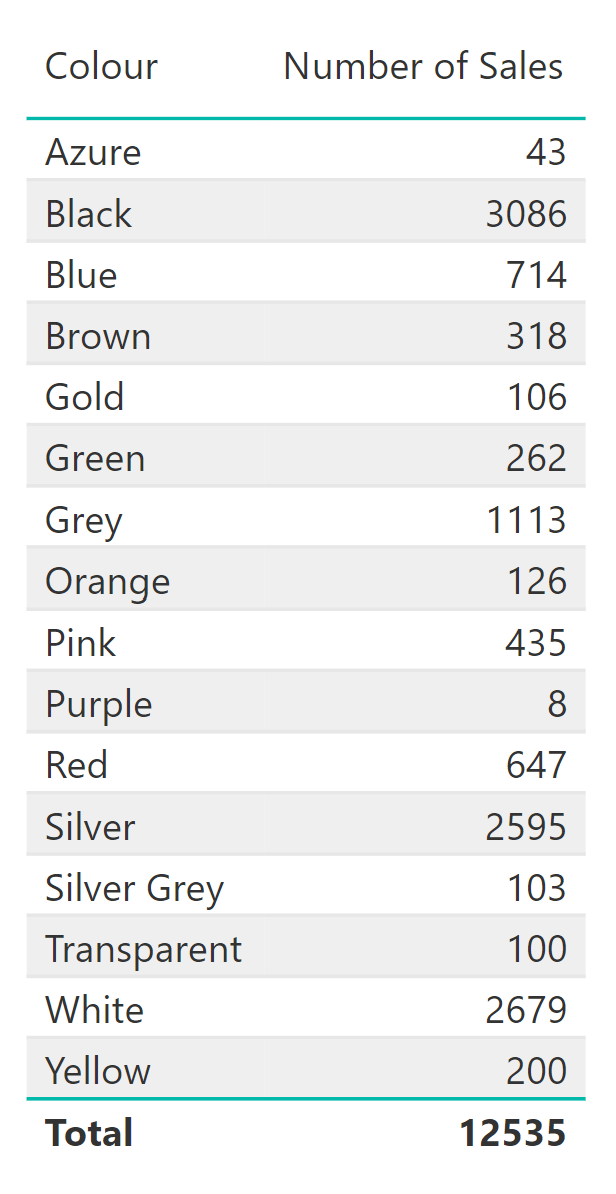
Number of Sales = COUNTROWS(EVALUATEANDLOG('Sales'))
When we add this measure to a table visual containing the 'Colour' column from the 'Product' table. We can see the total number of sales recorded for each product colour. The EVALUATEANDLOG function enables us to visualise how these totals have been calculated.
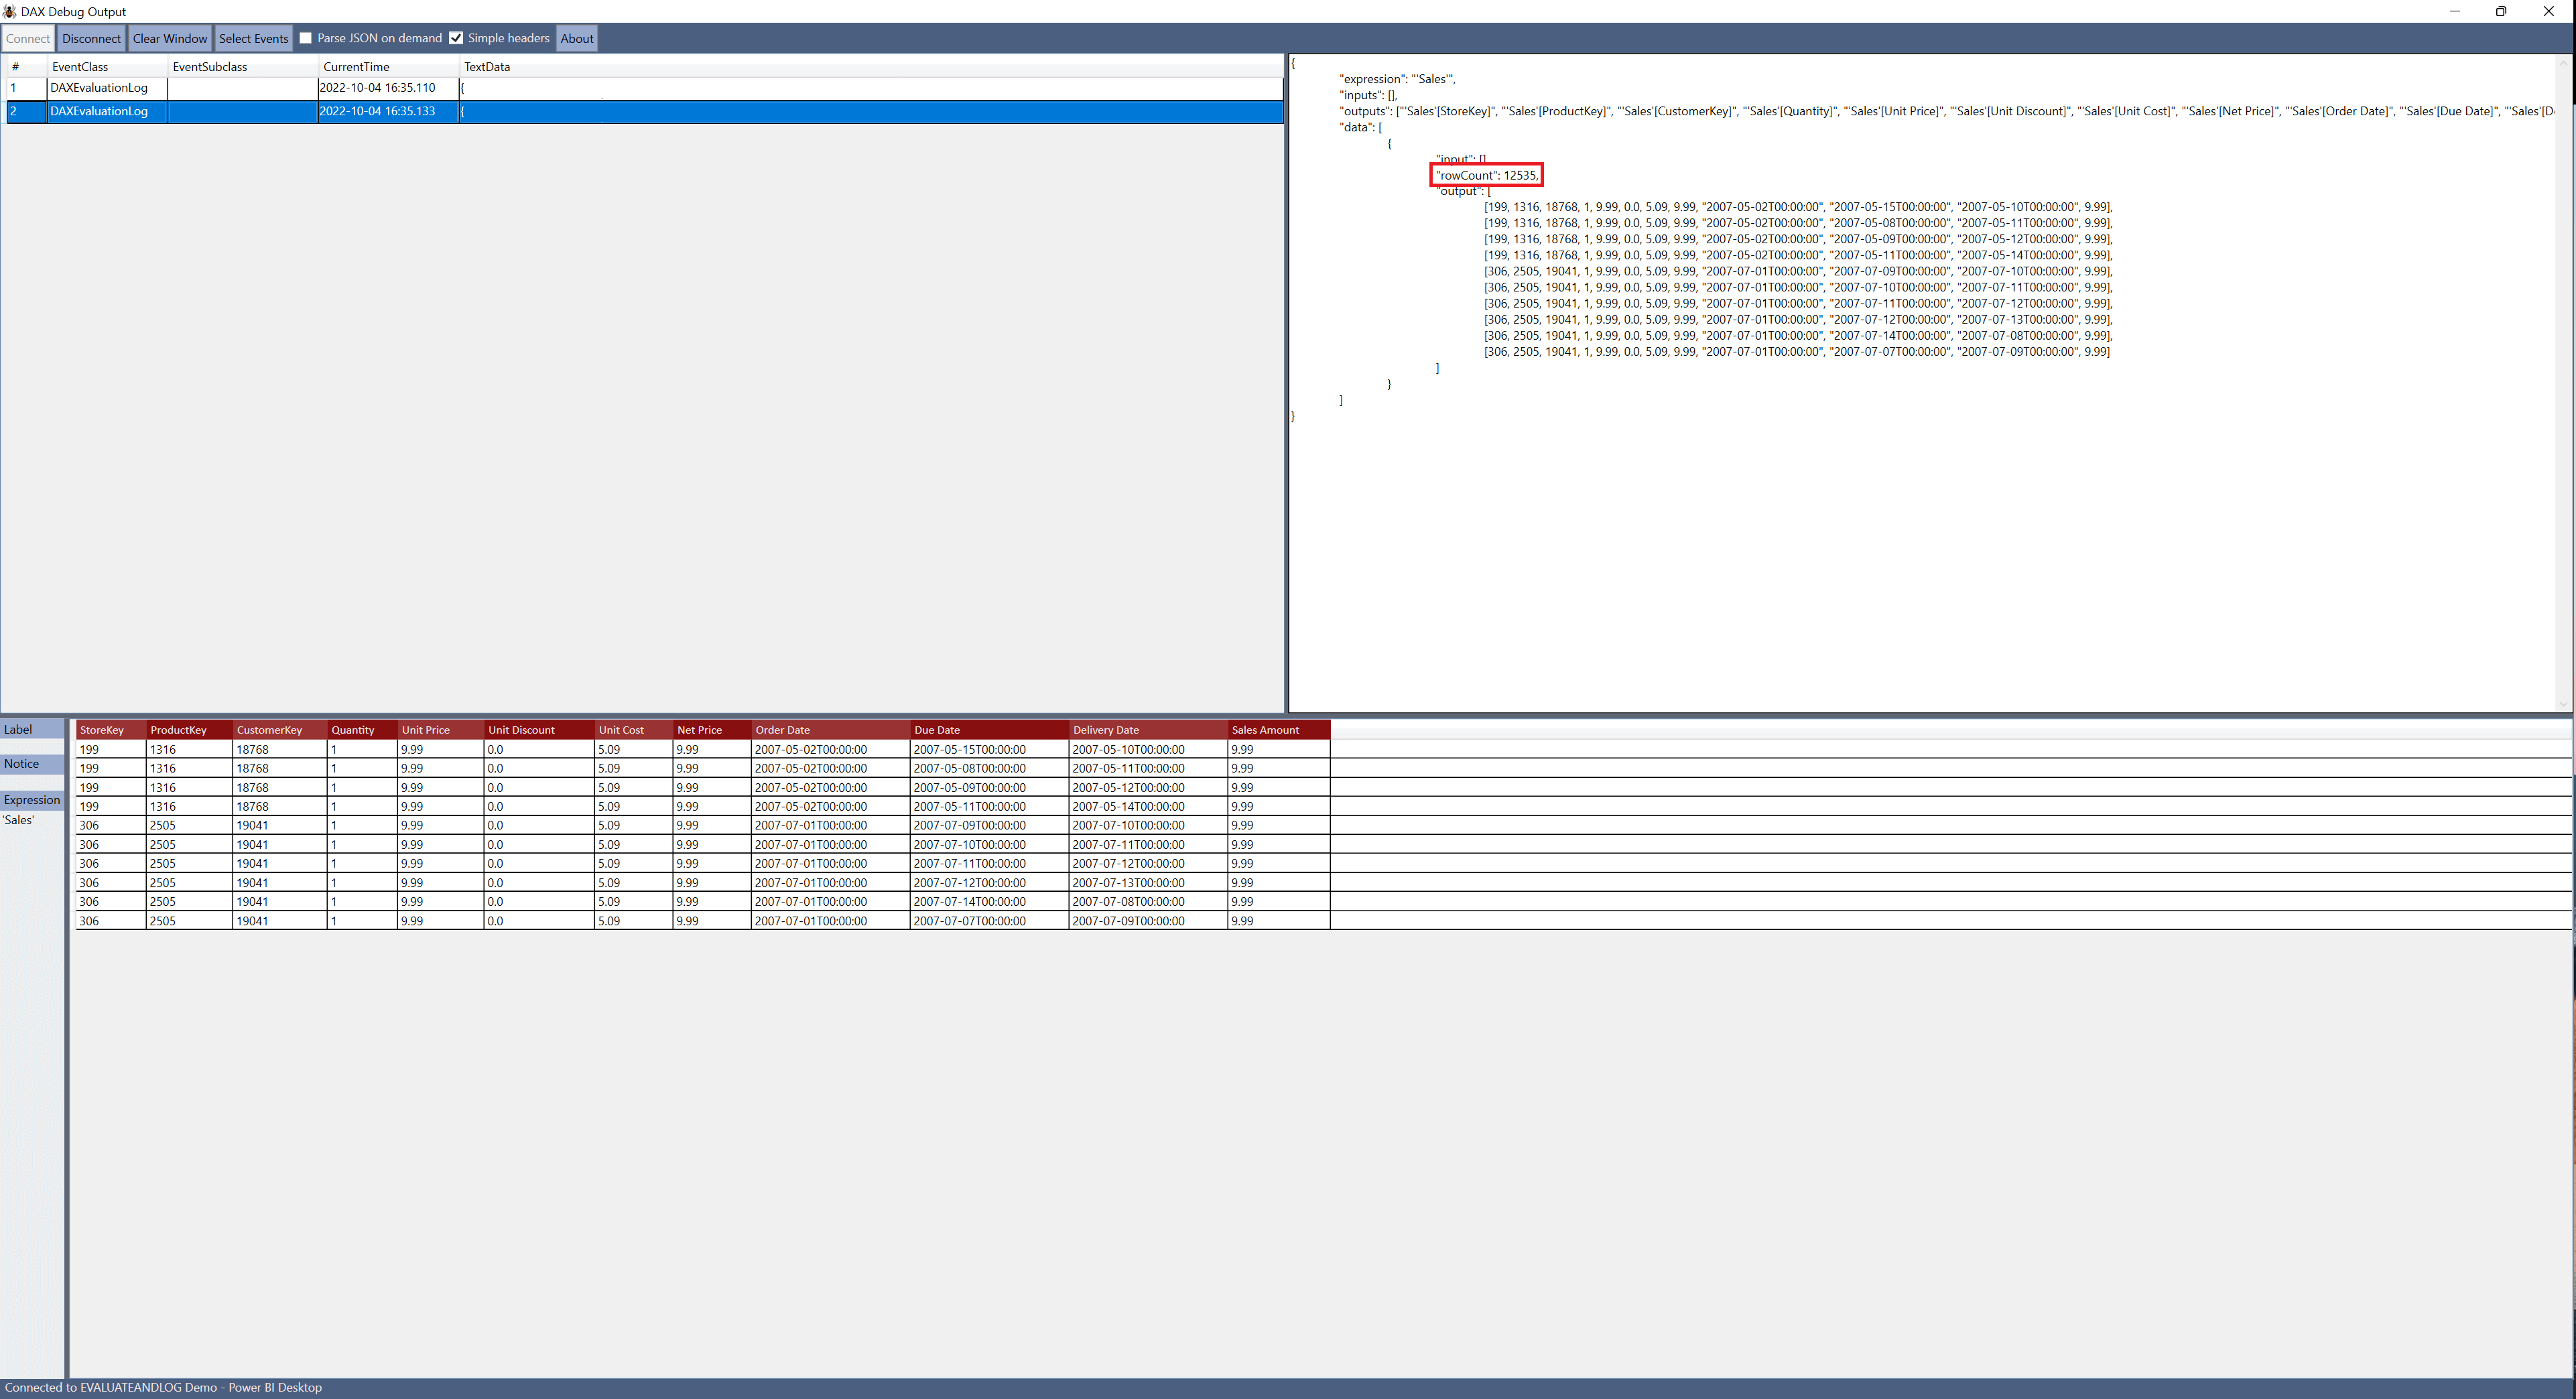
By connecting to the Power BI report in Dax Debug Output, we can see that the table expression generates two DAXEvaluationLog events. We can see in the first DAXEvaluationLog event, under the "data" property, there are 16 intermediate tables that have been generated, one for each product colour (the first 3 of which have been highlighted in red). The "outputs" property in the JSON document, lists the columns that make up the schema of the "output" tables.

In the second DAXEvaluationLog event, there is only one table, and the value of the "rowCount" property corresponds to the total value which we can see in the table visual.
Output of the EVALUATEANDLOG function for scalar expressions
You can also wrap the EVALUATEANDLOG function around scalar DAX expressions, which are expressions that return a single value.
For example, we can use EVALUATEANDLOG with the COUNT function.
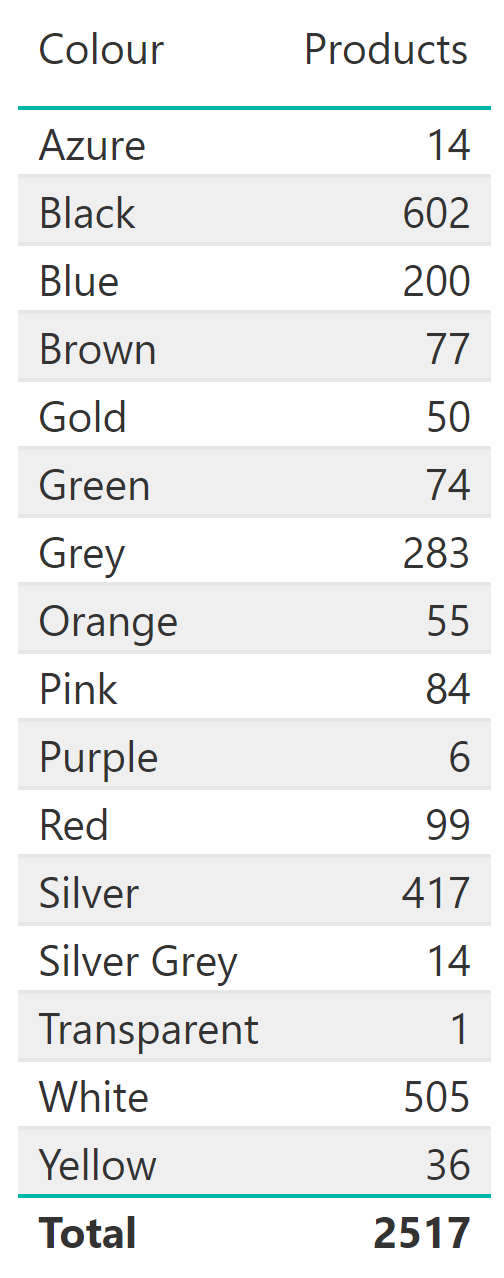
Products = EVALUATEANDLOG(COUNT('Product'[Product Name]))
When we add this measure to a table visual containing the 'Colour' column from the 'Product' table. We can see the total number of available products there are of each product colour. The EVALUATEANDLOG function enables us to visualise the inputs and outputs when the expression is evaluated.
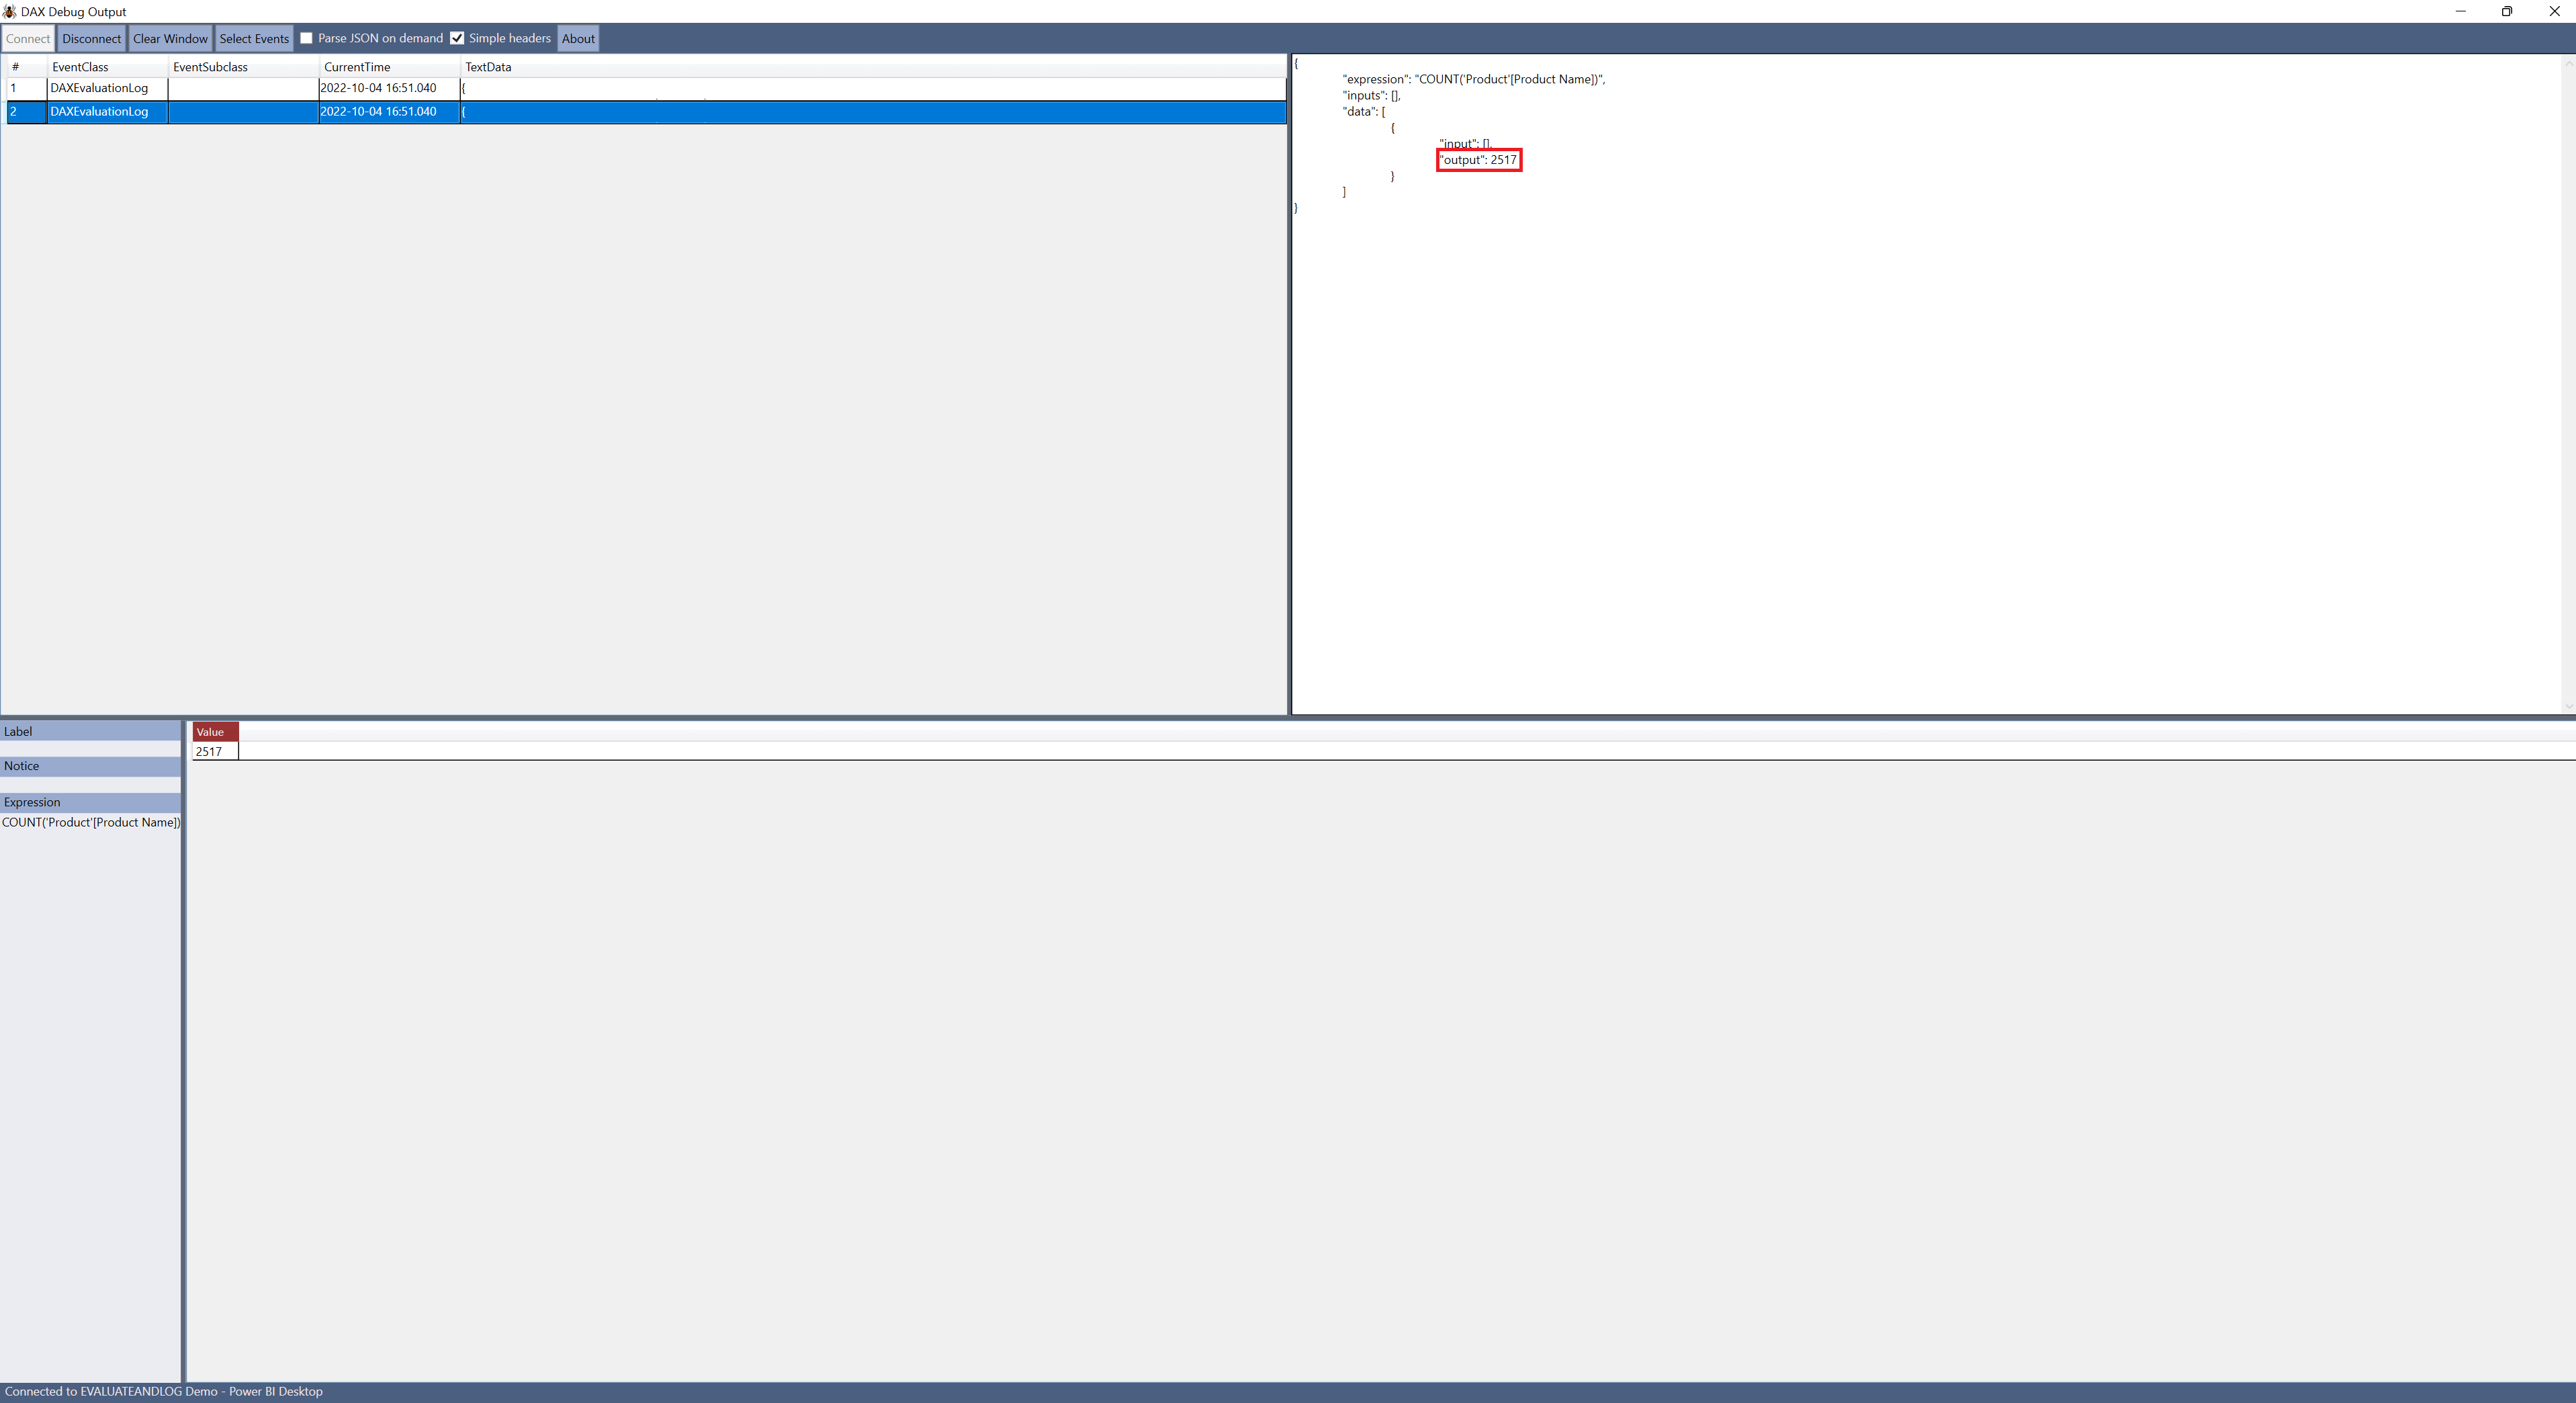
By connecting to the Power BI report in Dax Debug Output, we can see that the scalar expression generates two DAXEvaluationLog events. We can see in the first DAXEvaluationLog event, that 16 "input" and "output" pairs have been generated. When the DAX expression is calculated, the "input" values are the different product colours. For each "input" value (product colour) a corresponding "output" value is returned.

In the second DAXEvaluationLog event, the value of the "output" property corresponds to the total value which we can see in the table visual. There are two DAXEvaluationLog events because the DAX expression has been calculated twice. Once for each product colour, and once to calculate the value we see in the total row.
Conclusion
In this blog post, we have seen that EVALUATEANDLOG is a powerful new function in DAX. EVALUATEANDLOG has brought debugging capability to Power BI by allowing users to visualise how DAX is operating "under the hood".

