A simple toolkit for IT budgeting and planning


TLDR; this blog describes a toolkit that will enable you to optimise your IT budget. In the current economic climate, technology budgets are likely to come under increasing pressure. This toolkit can be used to optimise your budget by identifying opportunities to both root out waste and direct investment to where it is needed most. It achieves this by taking an evidence driven approach to engage senior decision makers, reach consensus and make fundamental decisions about future investments in technology.
We work with technology leaders across a wide array of industry sectors. A common theme we see is the sheer volume of apps, tools, packages, platforms and bespoke software that an organisation can accrue in their technology portfolio over time. If left unchecked, this portfolio can grow to the point where the finite technology resources and the ever increasing demands placed upon them become incompatible.
The toolkit we describe is effectively a "stock take" of your technology portfolio, allowing you to measure the business value and technical health of every digital asset that is in use by the organisation. By collating this information, you can then take an evidence driven approach to focus investment on the assets which deliver the greatest value and identify assets that should be retired in order to recover budget.
The foundation of this approach is a digital asset register which captures all of the assets in organisation's technology portfolio, enabling each to be assessed across two dimensions: business impact and technical efficacy.

This assessment is then used to generate actionable insights that will:
- Engage senior decision makers - by providing them with situational awareness
- Drive decisions - by clearly indicating where budget and resources need to directed to generate long term value
- Enable a regular cycle of governance - by supporting a feedback loop that allows plans and budgets to be regularly reviewed and adjusted to meet the goals of the organisation
- Build a better understanding of the organisation's overall digital maturity and to take action accordingly
It achieves this through a six stage approach.
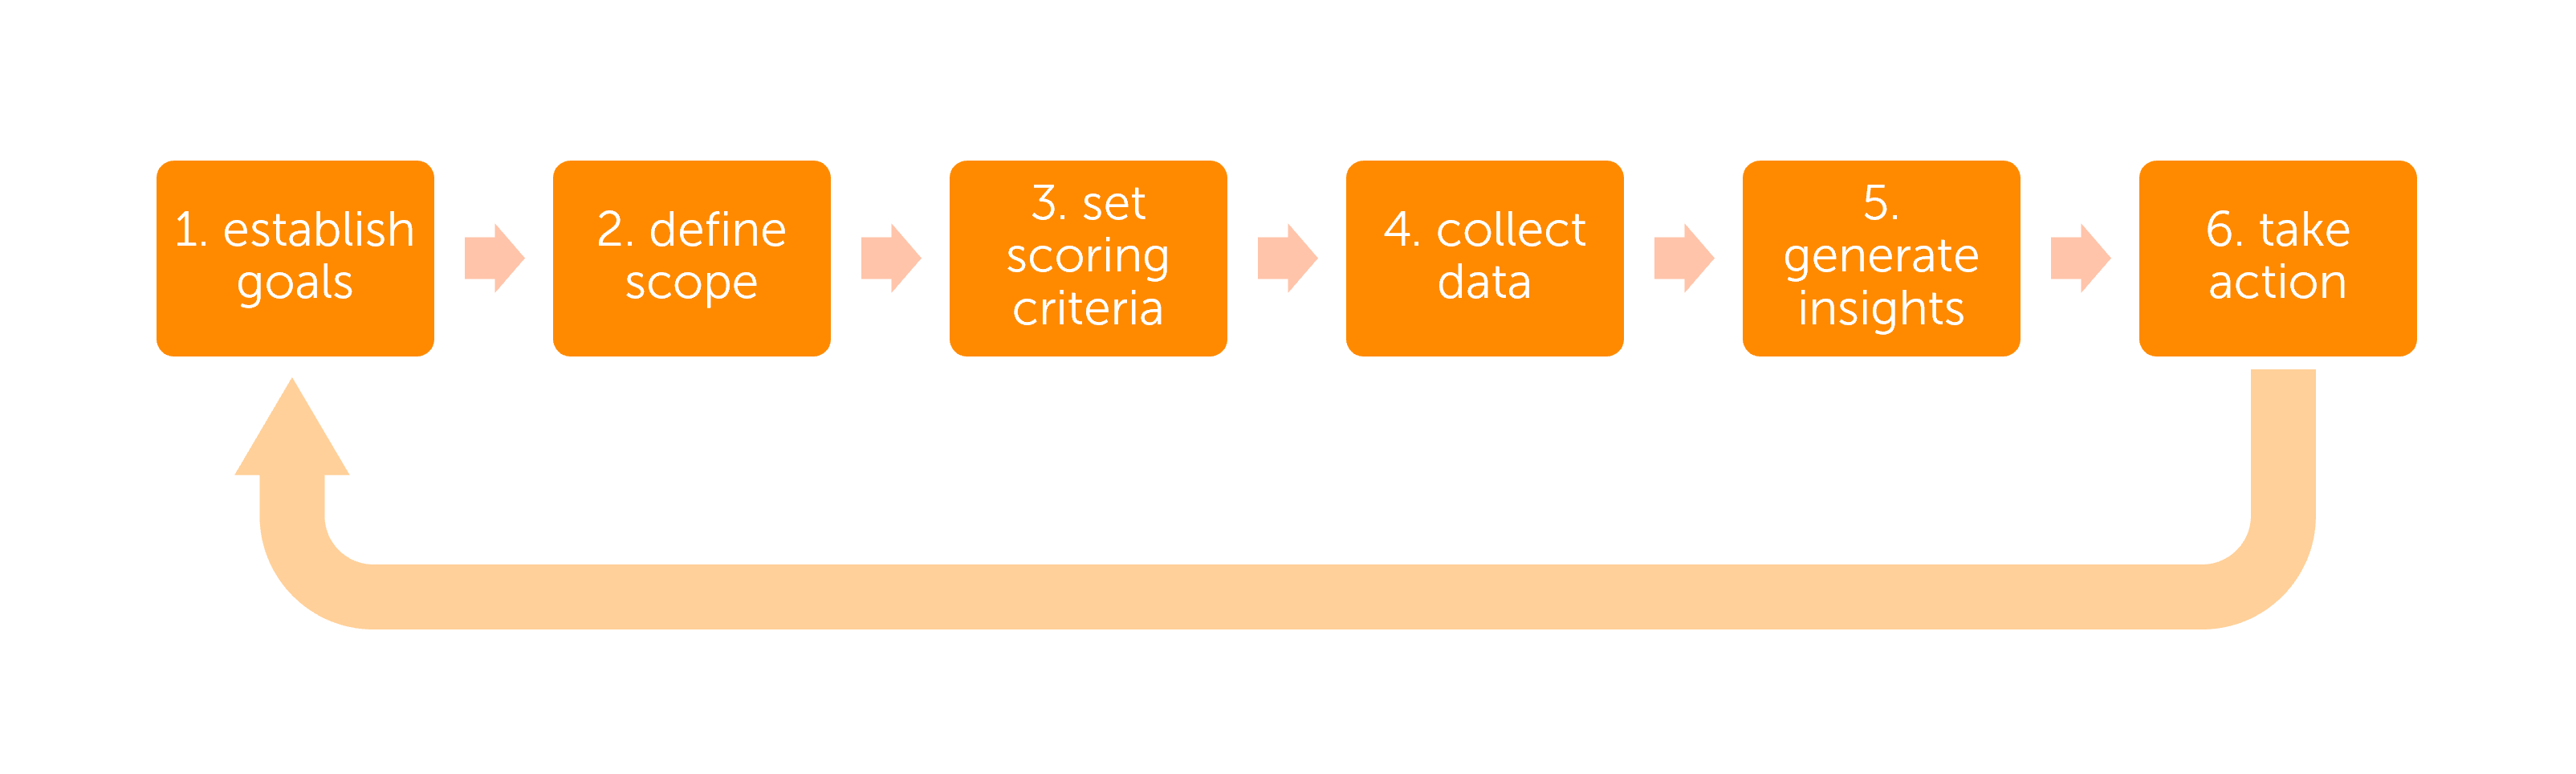
Stage 1 - establish the goals
Set the objectives you are seeking to achieve and tailor the approach accordingly. In the current economic climate, these goals are likely to be:
- Identifying opportunities where IT spending can be reduced. For example, retiring a legacy technology that the organisation can live without.
- Ring fencing investment in technology that is critical to the organisation in areas such as operational efficiency, revenue generation or regulatory / legal compliance
- Identifying where there is untapped value in the technology portfolio. For example, highlighting how an application that enables productivity could be more widely adopted within the organisation.
Stage 2 - define the scope
Define the digital assets that you want to consider. The analysis often benefits from being targeted on a specific area. For example, you may choose to focus on one of the following domains:
- Customer / client facing technology;
- Commercial Off The Shelf (COTS) software products, including SaaS;
- Bespoke software that has been developed in house by your engineering team(s);
- Bespoke software that you have commissioned an external party to develop;
- Tools that have been developed within the wider business - e.g. "citizen developer" assets such as spreadsheets;
- Internal productivity tools - e.g. messaging and communications;
- The digital assets that are relevant to a specific department or line of business.
Stage 3 - set the scoring criteria
To make the insights simple and effective, you are aiming to generate a score for each asset across two dimensions:
- Business Impact;
- Technical Efficacy.
To help explain what these dimensions measure, it is often useful to consider the extremes in each case:
| Dimension | Worst case scenario | Best case scenario |
|---|---|---|
| Business impact | No value to the organisation | Business critical, strategically important |
| Technical efficacy | Burning platform in terms of outages and support | Solid platform that is easy to operate and maintain |
To enable these scores to be generated, each dimension should be decomposed into smaller components, tailoring as necessary to support the objectives and adopting language that is familiar within your organisation.
For example, the Business Impact dimension can be decomposed into the following components:
- Revenue generation - does the asset contribute directly towards generating revenue for the organisation?
- Operational efficiency - does the asset enable the organisation to deliver its products / services more efficiently and to scale up confidently to meet demand?
- Risk mitigation - does the asset play a key role in mitigating risks faced by the organisation?
- Compliance - is the asset critical to enabling the organisation to comply with mandatory laws and regulations?
- Level of adoption - is the asset widely adopted by end users (staff, clients, customers)?
- Business strategy - is the asset key to supporting the long term vision of the organisation?
- End user needs - does the asset meet the expectations of end users?
- Business ownership - does the asset have clear business owner(s) who play an active role in ensuring it achieves (and sustains) the intended business impact? Is there a roadmap in place that transcends any change in ownership?
For example, the Technical Efficacy dimension can be decomposed into the following components:
- Operational performance - does the asset perform reliably, or do we see a high number of support requests being raised?
- Supply chain - are the underlying software packages, frameworks, platforms and infrastructure that the asset relies on up to date? Is the Software Bill of Materials (SBOM) defined?
- Infrastructure - is the underlying infrastructure secure and scalable? Is it cost effective?
- DevOps - is the source code under source control? Are CICD processes in place? Are DTAP environments available? Are automated processes in place to deploy the application?
- Technical debt - is the asset carrying a low level of technical debt, or is there a growing backlog of bugs, upgrades and refactoring tasks?
- Knowledge - is the asset fully documented and is knowledge about it shared by a wide range of people in the organisation, or is it undocumented and only understood by a small number of people?
- Technology strategy - is the asset aligned to the long term vision set out in the technology strategy?
- Technical ownership - is the asset owned by a specific team within the organisation? Are they given sufficient capacity to proactively maintain the asset?
A set of statements should then created to assess each component. For example, to assess the "End user needs" component above we may ask respondents to score two statements:
The application provides all of the functionality that end users need.
and
The application is easy to use.
Scoring should be kept simple. For example, the Likert scale serves this purpose welll:
| Statement | Score |
|---|---|
| Strongly agree | +2 |
| Agree | +1 |
| Neither agree nor disagree | 0 |
| Disagree | -1 |
| Strongly disagree | -2 |
Stage 4 - identify audiences and collect the data
In order to score each of the individual components above, you will need to engage with different audiences across the organisation to generate a holistic view of each asset. It is useful to develop a matrix (see below) by mapping out which components are relevant to each audience:
| Dimension | Component | App / Product Owners | IT Operations | Engineering | End Users | Risk & Compliance |
|---|---|---|---|---|---|---|
| Business impact | Revenue generation | X | X | |||
| Business impact | Operational efficiency | X | X | |||
| Business impact | Risk mitigation | X | X | X | ||
| Business impact | Compliance | X | X | X | ||
| Business impact | Level of adoption | X | X | |||
| Business impact | Business strategy | X | X | |||
| Business impact | End user needs | X | ||||
| Business impact | Business ownership | X | ||||
| Technical efficacy | Operational performance | X | X | X | X | |
| Technical efficacy | Supply chain | X | X | |||
| Technical efficacy | Infrastructure | X | X | |||
| Technical efficacy | DevOps | X | X | |||
| Technical efficacy | Technical debt | X | X | |||
| Technical efficacy | Knowledge | X | X | |||
| Technical efficacy | Technology strategy | X | X | |||
| Technical efficacy | Technical ownership | X | X |

This matrix enables a communication and engagement plan to be developed and questionnaires to be tailored to each audience.
We use the Likert component in Microsoft Forms or an Excel spreadsheet to compose questionnaires, issue them to respondents and collect the results.
Stage 5 - generate insights
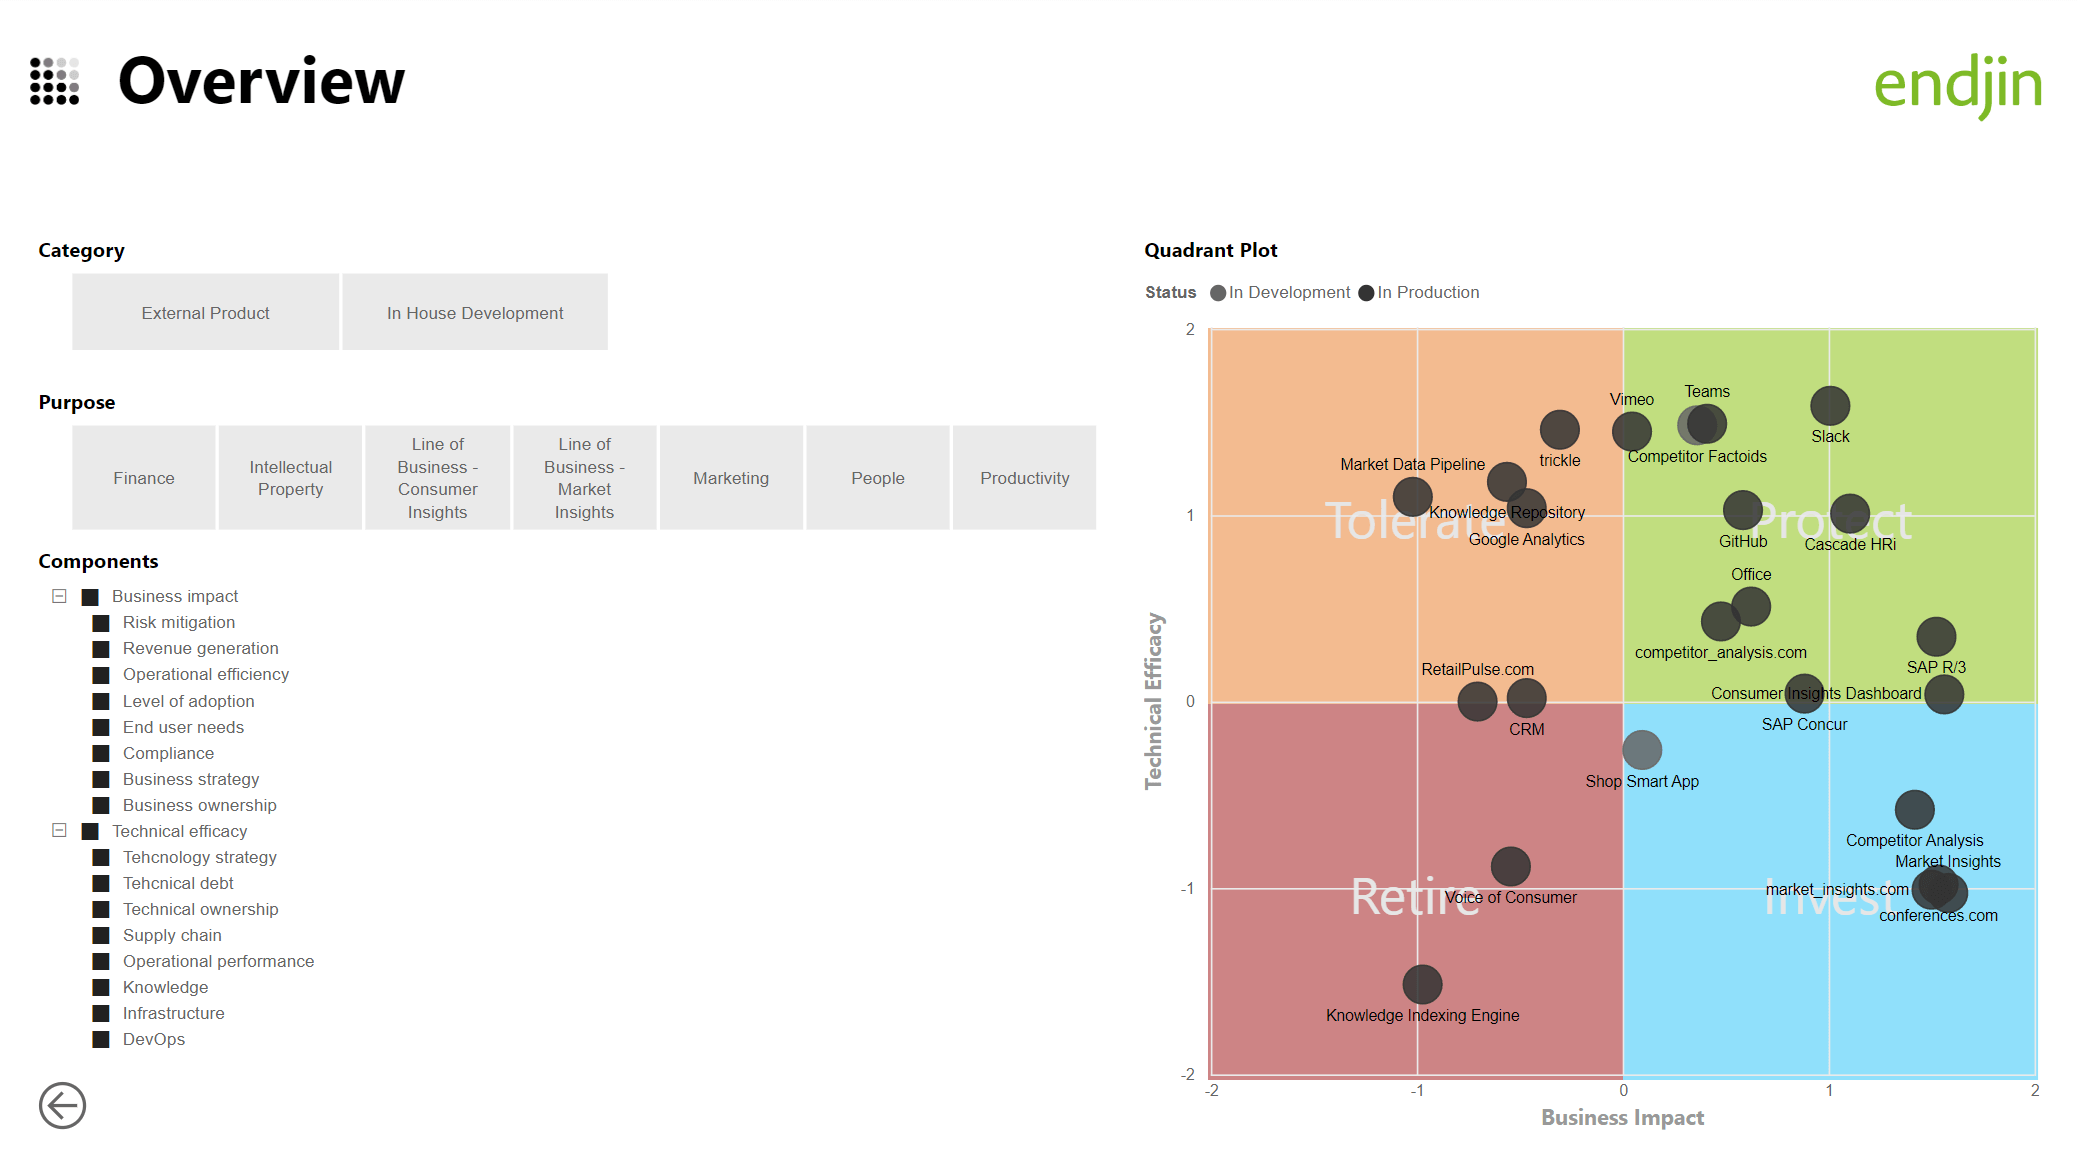
Once responses to the questionnaires have been collected, the output is consolidated and analysis is generated. We use a Jupyter notebook to ingest the raw data generated by questionnaire responses and generate a single integrated data set that can be analysed in Power BI.
We find that the most engaging insight is to create a scatter plot in Power BI where each asset is a point, it's location is driven by:
- A vertical axis defined by the averaging the scores related to the technical efficacy dimension;
- A horizontal axis defined by the averaging the scores related to the business impact dimension.
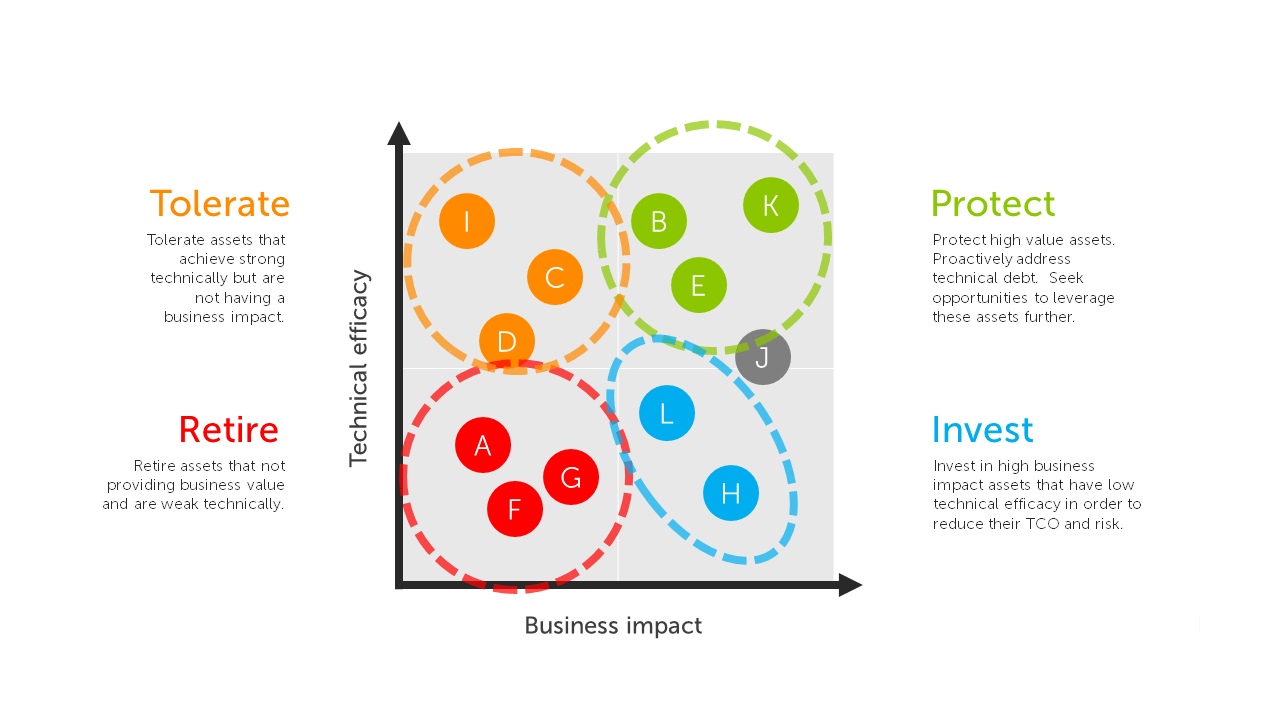
This leads to a visualisation as follows:
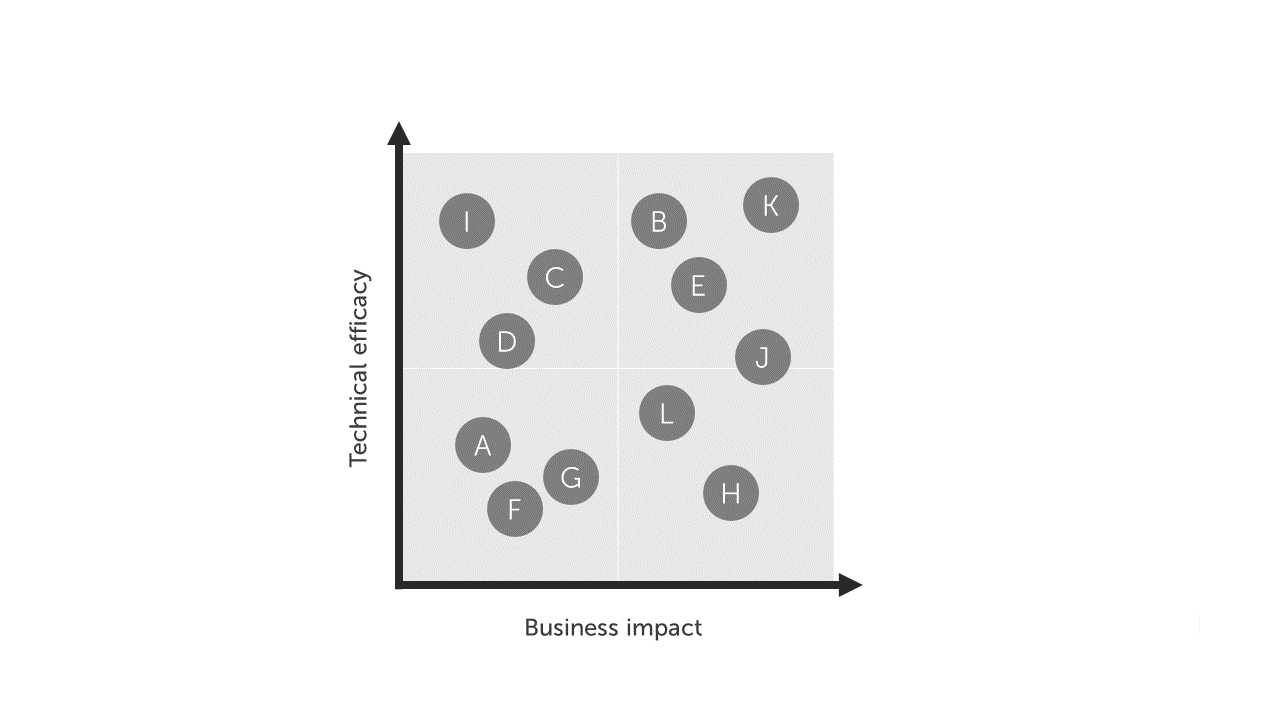
This then allows you to categorise the digital assets according to the following clusters:
In practice this can be used to generate a interactive experience where digital assets can be filtered and explored:
Stage 6 - take action
With the individual assets assigned to one of four broad categories, it is now possible to develop a strategy based on the following set of principles:
- Protect high value assets. Ensure that technical debt is being proactively addressed. Understand what factors that have led to these assets being a success, seek to apply these to the wider portfolio;
- Invest in high business impact assets that have low technical efficacy. Seek to lower the TCO, and address technical debt that could put the business value they generate at risk;
- Tolerate assets that are strong technically but are not having a significant business impact. Challenge owners to find ways to generate more value from these assets;
- Retire assets that are not providing business value and are weak technically. Do this to release budget that can be redirected to higher value assets.
We find that this leads to strong engagement from senior stakeholders, because a greater situational awareness is being achieved. This then allows you to take concrete action, for example:
Assets that fall into the "protect" category are effectively your crown jewels. It does no harm to remind senior stakeholders what these are! We also find that stakeholders will be interested in what has led to these specific assets achieving this level of success. This is a fantastic opportunity to highlight key success factors such as the adoption of a "cloud first" architecture, the performance of a specific engineering team or where a "business led" approach is being adopted;
Assets that fall into the "invest" category raise awareness of digital assets that are critical to the organisation but have been allowed to fall into disrepair. This often leads to a positive outcome where stakeholders agree to prioritise the budget necessary to restore these assets to a more solid footing. We also find that stakeholders will raise questions about what has led to this situation. This is an opportunity to highlight the need for sustained investment in these assets;
Where an asset falls into the "retire" category, the next action should be to give the relevant owner(s) an opportunity to make their case to retain it. In many cases we find that they will struggle to provide sufficient evidence and will in turn accept the evidence agreeing to the asset being retired. Once a "retire" decision has been made, budget may need to be set aside to "end of life" the asset. The budget released by the decommissioned asset can be reinvested in higher value assets in the portfolio;
Finally where an asset falls into the "tolerate" category, the next action should be for owner(s) to develop a plan to drive more business value from it. In many cases this can put impetus behind wider adoption of the asset, but if it fails to achieve this, a decision to "retire" can ultimately be made.
The "retire" and "tolerate" categories enable you to cut through personal motivations to make decisions that will benefit the organisation as a whole:
"It is difficult to get a person to understand something, when their salary depends on them not understanding it." Upton Sinclair
Conclusion
This toolkit generates a high level, clinical view of the estate, where everything is measured equally. It creates a level of situational awareness that enables senior decision makers to become actively involved in making top down, dispassionate, strategic decisions about technology plans and budgets.
The toolkit is light touch and repeatable, giving technology leaders an opportunity to engage stakeholders on a regular basis (we recommend every quarter) to track the impact of the decisions that have been made historically, to review the latest picture and to change course as necessary.
Finally, it's an opportunity for technology leaders to demonstrate the value of data driven decision making.