Automating Excel in the Cloud with Office Scripts and Power Automate


Excel is a highly utilised piece of software, with a huge number of people and businesses benefitting and relying on its functionalities. Excel Online is the online version of Excel, were users interact with the software through a browser, with data being stored in the cloud.
For the desktop version of Excel there are VBA (Visual Basic for Applications) macros, which provide users the ability to get more out of Excel by writing programs to automate processes. Similarly, for Excel Online, there are Office Scripts, which is a feature designed for automating Excel-based processes in the cloud – augmenting the power and utility of Excel.
The cloud offers great opportunities for automation, and Power Automate is an online, cloud-based tool for creating automation workflows; combined with Excel Online and Office Scripts, it further expands the ability to automate Excel-based processes.
In this post I'm going to give a broad overview of Office Scripts and Power Automate, and walk through an example that demonstrates how the combination can be used to automate typical manual business processes.

About Office Scripts and Power Automate
Office Scripts
You can begin working with Office Scripts by clicking on the Automation tab in the top ribbon of an Excel Online workbook. From here you can use the code editor for writing scripts. Alternatively you can use the Action Recorder feature which will record the actions that you take in the workbook and generate a script representing the sequence of actions, the script can then be ran in the future to reproduce the sequence.
The programming language of Office Scripts is TypeScript. There are Office Script APIs for interacting with objects representing the different parts of a workbook, for example Workbook, Table, and Chart. See this Microsoft Docs article to get familiar with the basics of Office Scripts. Once you have finished writing a script, you can save it to the cloud and run it against any Excel Online workbook in the future.
Power Automate
To begin using Power Automate head over to its homepage. Power Automate uses a system of simple no-code triggers and actions – like, when an email arrives (trigger), save the attachment (action) – that can be chained together to produce complex automation workflows. You can find a getting started tutorial on their website, and a huge collection of pre-built templates that you can mine ideas from and use as bases for your own flows.
Example
Imagine the following scenario: a supermarket chain records all of their sales data in Excel spreadsheets; every Monday morning an employee completes the following time-consuming, manual process: an email arrives containing the previous week's sales data for each store, they copy the data from the spreadsheet into a primary spreadsheet containing the sales data for the whole year, runs a VBA macro that refreshes pivot tables and charts and produces a report, they then send the report in an email to their manager.
The following example demonstrates a solution that automates this process.
Extracting data from the emailed spreadsheet
Here's an example of a weekly sales data spreadsheet that we need to extract data from.
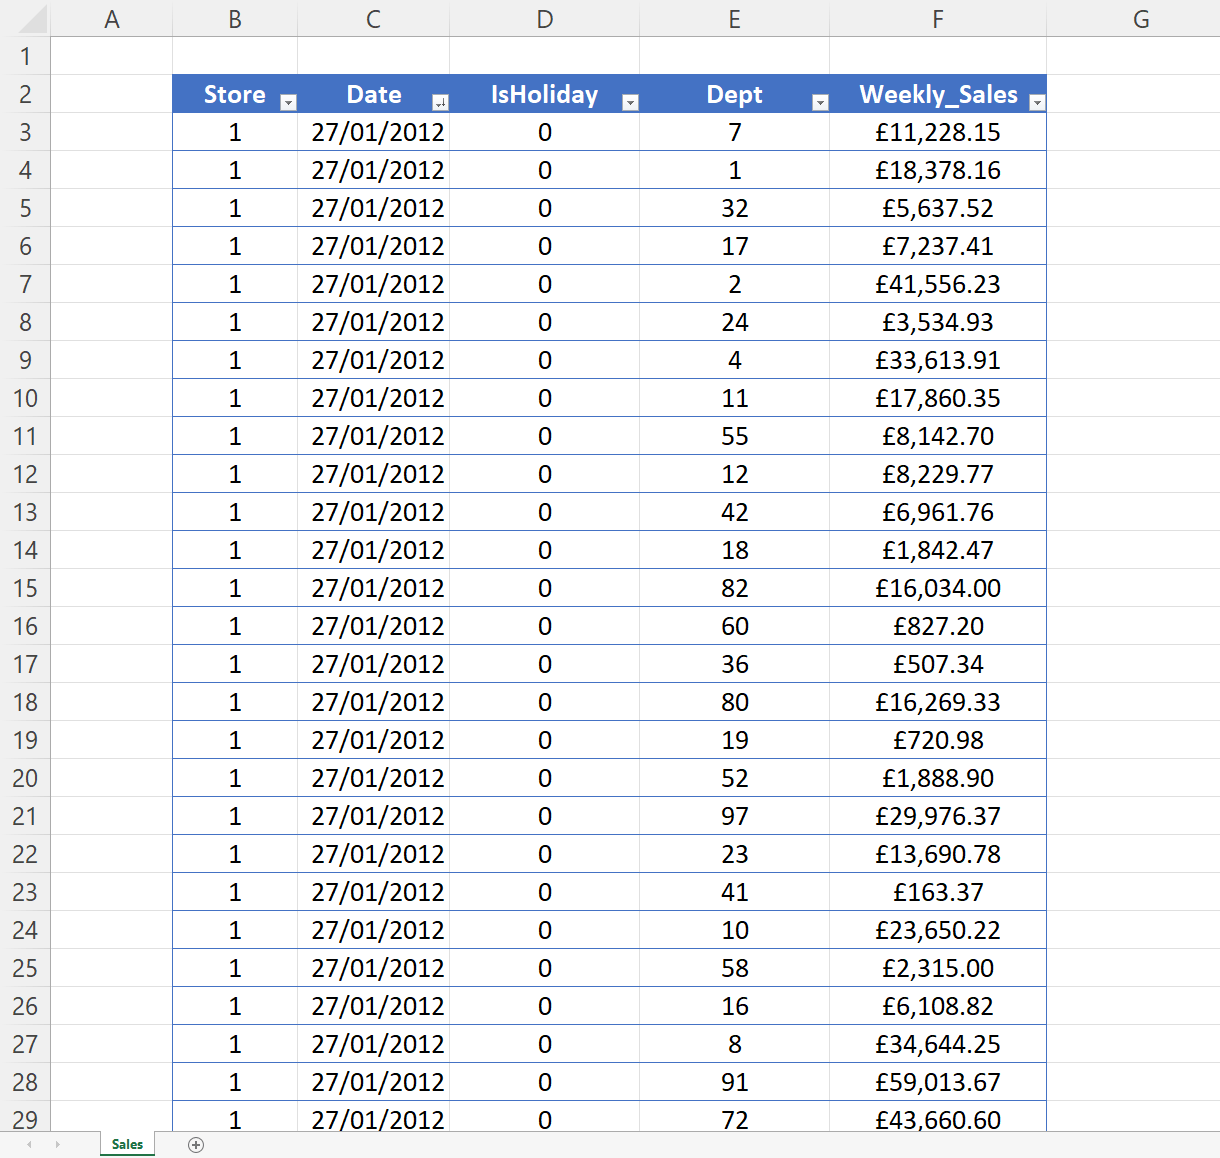
We need an Office Script that automates the process of selecting and copying the sales data from the spreadsheet that arrives by email.
function main(workbook: ExcelScript.Workbook): string {
  // Get the first table in the "Sales" worksheet.
  let table = workbook.getWorksheet('Sales').getTables()[0];

  // Get the rows in the Sales table.
  let range = table.getRangeBetweenHeaderAndTotal();
  let rows = range.getValues();

  // Save each row as a SalesData object. This lets them be passed through Power Automate.
  let records: SalesData[] = [];
  for (let row of rows) {
    let [store, date, isHoliday, dept, weeklySales] = row;
    records.push({
      store: store as number,
      date: date as number,
      isHoliday: isHoliday as number,
      dept: dept as number,
      weeklySales: weeklySales as number
    })
  }

  // Log the event data to the console and return it for a flow.
  let stringResult = JSON.stringify(records, null, 1);
  console.log(stringResult);
  return stringResult;
}

// An interface representing a row of sales data.
interface SalesData {
  store: number
  date: number
  isHoliday: number
  dept: number
  weeklySales: number
}
The Office Script above is extracting data from the Sales worksheet and returning it as a JSON string, which is necessary for it be passed as an output in a Power Automate flow. Let's walk through what it's doing step-by-step. First we're extracting the data from the first table inside the Sales worksheet, which results in the rows variable, which is a 2D array of strings, with each inner array representing a row of data; next, we're parsing each of those inner arrays and storing them as SalesData objects – defined by the interface at the bottom of the script, this is necessary for when we come to serialise to JSON (it ensures that the properties on the SalesData objects (store, date, etc) correspond to properties in the resulting JSON); finally we're serialising the resulting array of SalesData objects as a JSON string and returning the result.
Inserting the previous week's sales data into the primary spreadsheet
Here's what the primary sales data spreadsheet looks like.

We now need an Office Script that will take the data extracted by the first Office Script and insert it into the table containing the entire year's sales data inside the primary spreadsheet.
function main(workbook: ExcelScript.Workbook, latestSalesData: string): void {
    // Insert data into 'Sales' table
    let latestSalesDataToInsert: (string | number | boolean)[][] = mapSalesDataToArray(latestSalesData);
    let table = workbook.getWorksheet('Sales').getTables()[0];
    table.addRows(0, latestSalesDataToInsert);

    // Function to map JSON string to 2D array
    function mapSalesDataToArray(salesData: string): (string | number | boolean)[][] {
      let salesDataParsed: SalesData[] = JSON.parse(salesData)
      let dataToInsert: (string | number | boolean)[][] = [];
      for (let row of salesDataParsed) {
        dataToInsert.push([
          row.store,
          row.date,
          row.isHoliday,
          row.dept,
          row.weeklySales
        ]);
      }
      return dataToInsert;
    }

    // An interface representing a row of sales data.
    interface SalesData {
        store: number
        date: number
        isHoliday: number
        dept: number
        weeklySales: number
    }
}

The first thing to notice is the latestSalesData parameter for our top-level main function. The JSON string outputted from the first Office Script will be passed as an argument to this parameter (note: it's the Power Automate flow, which we'll get to later, that passes the output from the first script as input to the second).
This script is using the mapSalesDataToArray function, that I defined, to map the incoming JSON string into an array of arrays (again, with each inner array representing a row of data), which is required by the addRows method. The function first uses the JSON.parse method to parse the JSON string into an array of SalesData objects, it then loops through each of those objects and pulls out the data into an array, resulting in the required 2D array of data.
Extracting charts and table as images for report
Next, we need an Office Script to extract images of charts and a summary table, to be sent to the manager as a report. There's another sheet in the primary excel file in which I have created pivot tables and charts. We need this Office Script to first refresh the pivot tables and charts in there, so that they contain the inserted data, and afterwards capture the images.

There are two pivot tables: 'PivotTable1' & 'PivotTable2', and a collection of charts which have been grouped together, resulting in the collection becoming a Shape object, which I have named 'report'. We want to extract an image of the collection of charts (i.e. 'report') and the top left pivot table ('PivotTable1') in the image above. The pie chart uses 'PivotTable2' and displays the composition of sales across the different stores for a given week – determined by the Date filter on 'PivotTable2'; we therefore need to filter 'PivotTable2' with the date to which this report corresponds. This isn't necessary for the other two charts as they're displaying the data against time (i.e. over multiple weeks).
function main(workbook: ExcelScript.Workbook, date?: string): ReportImages {
  // Recalculate the workbook to ensure all tables and charts are updated.
  workbook.getApplication().calculate(ExcelScript.CalculationType.fullRebuild);

  // Refresh the pivot tables and charts in the 'Chart' worksheet
  let reportSheet = workbook.getWorksheet("Report");
  reportSheet.refreshAllPivotTables();

  // Select the pivot table and shape objects from the worksheet
  const pivotTable1 = reportSheet.getPivotTable("PivotTable1");
  const pivotTable2 = reportSheet.getPivotTable("PivotTable2");
  const shape = reportSheet.getShape("report");

  // Filter PivotTable2 using 'date'
  const dateField = pivotTable2.getHierarchy("Date");
  dateField.getFields()[0].applyFilter({
    manualFilter: {
      selectedItems: [date]
    }
  })

  // Refresh the workbook to update charts
  workbook.getApplication().calculate(ExcelScript.CalculationType.fullRebuild);

  // Get images of the shape object (containing the charts) and the pivot table
  const shapeImage = shape.getImageAsBase64(ExcelScript.PictureFormat.png);
  const tableImage = pivotTable1.getLayout().getRange().getImage();
  return { shapeImage, tableImage }
}

// The interface for table and shape images.
interface ReportImages {
  shapeImage: string
  tableImage: string
}
Let's take a look at the script above for performing the image extraction. First we're refreshing the workbook to update the tables and charts, however this doesn't always work, so I've added some code to explicitly refresh the pivot tables in the 'Report' sheet. As mentioned earlier, 'PivotTable2' needs to be filtered for the date that the report pertains to, this is supplied by the date parameter to main function of this script, and is achieved by the applyFilter method. Next, I'm refreshing the workbook again so that the Pie Chart is in sync with the now updated 'PivotTable2'. Finally, I'm capturing images of PivotTable1 and shape (containing the charts), which get encoded as strings, and returning them as properties on a ReportImages object.
Orchestrating the process with Power Automate
Here's the high level overview of the Power Automate flow I put together for this process.
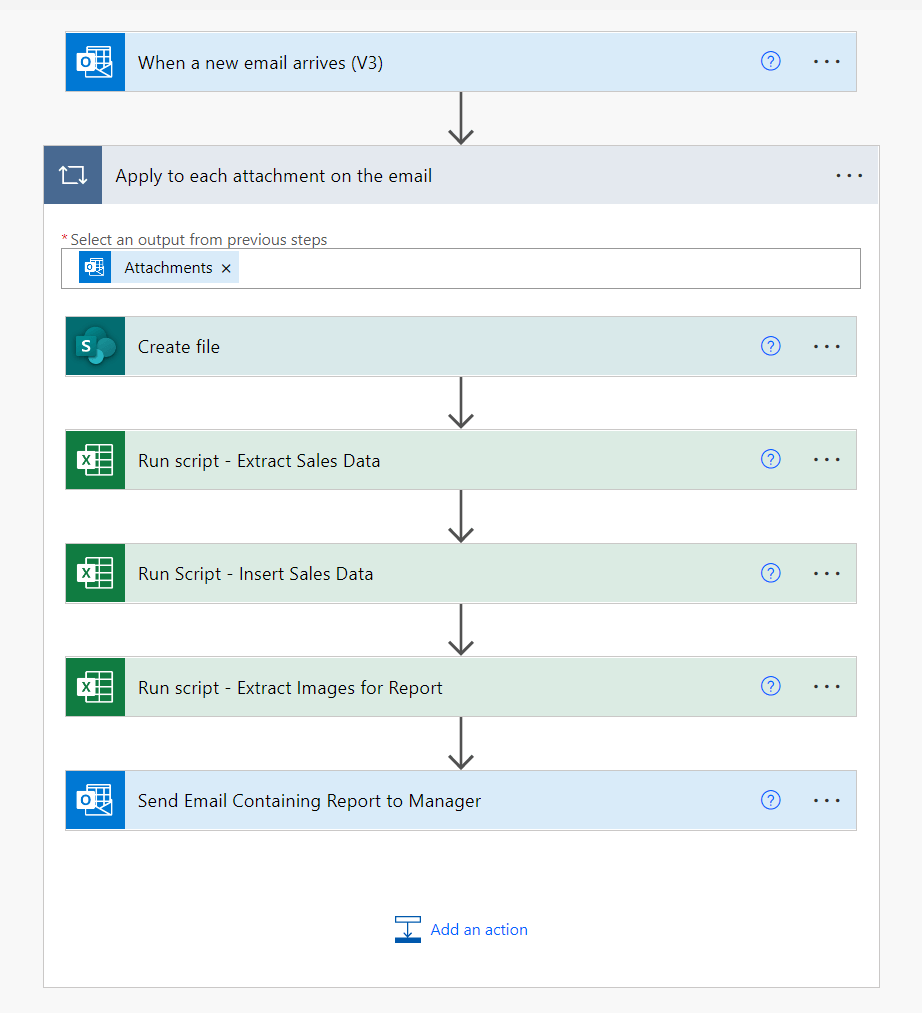
The event that triggers the employee's manual process is the arrival of an email from their manager, containing a spreadsheet attachment. Therefore, our Power Automate trigger should be the arrival of an email. We then want to save the spreadsheet attachment to a known place – maybe SharePoint or OneDrive; apply the first Office Script to that spreadsheet to select, copy and return the data as a JSON string; then pass that JSON string to the second office Script, which runs against the primary spreadsheet containing all sales data, and will insert the sales data encoded in the JSON string into a table in that spreadsheet; then refresh the pivot tables and charts in the Report sheet of the primary spreadsheet, and capture images for the report; and finally send those report images back to the manager via email.
Looking at the workflow in more detail

The image above shows the trigger and the first action in the workflow in more detail. The important settings from the 'when an email arrives' trigger is that Include Attachments and Only with Attachments are set to Yes. Notice the To and From email addresses are both my own, in reality the From would be the email address of the employee's manager. You could even include a subject filter, so that the flow is only triggered when the subject contains certain text, which would be useful if the employee receives lots of different emails with attachment from their manager.
The next steps are wrapped in an 'Apply to each attachment on the email', which is self-explanatory and is automatically added by Power Automate. Notice the output from the trigger being passed to these later actions is the email attachments, which is important; this is an example of what Power Automate call dynamic content. The 'Create file' step, too, is pretty self-explanatory: you select a SharePoint site; a folder within that site; then the file name, which is going to be the name of the file attached to the email – using dynamic content; and the file content is the content of the email attachment, which is also an example of dynamic content.
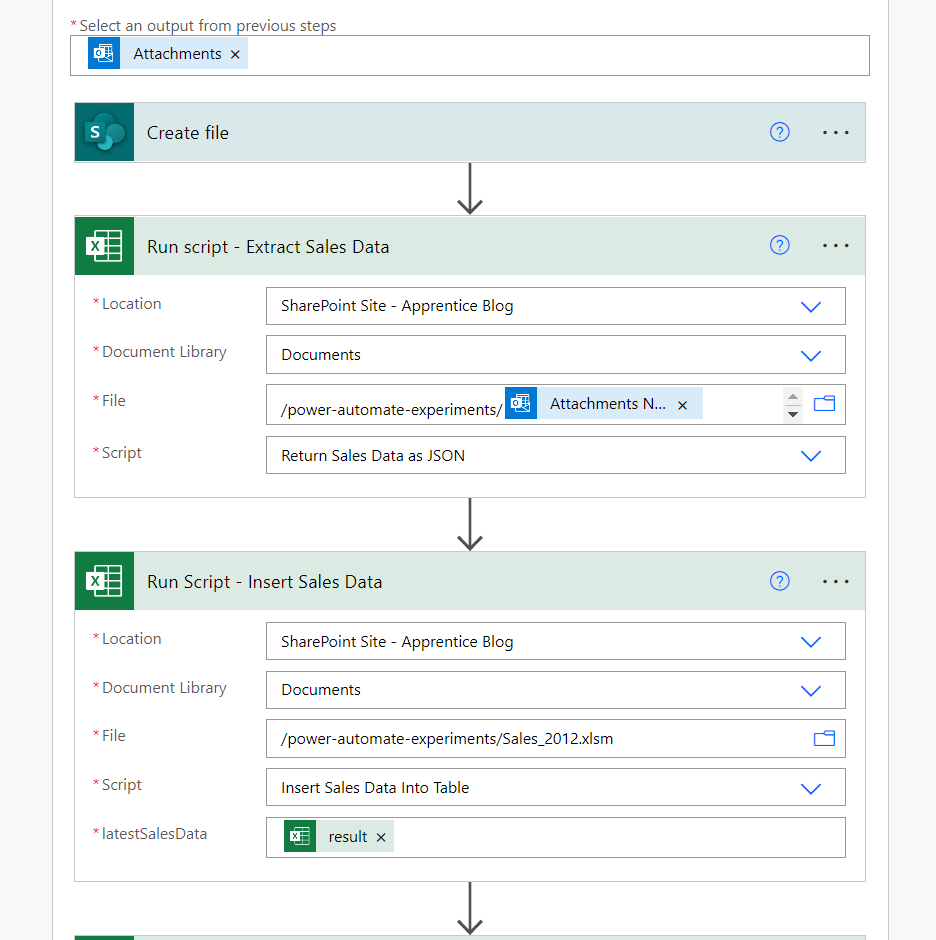
The image above shows the first two Office Script actions expanded. The first is the script to extract the sales data and return the result as a JSON string. Notice that this is using the dynamic content Attachments Name in the file path so that this script is executed on the email attachment that was saved to SharePoint in the previous action. The second script is performing the data insert into the primary sales spreadsheet – Sales_2012.xlsm. Notice the latestSalesData parameter at the bottom of this expanded action, this is the name of the parameter in the script for which the JSON string is passed; here we're passing the dynamic content result, which is the output from the first script.
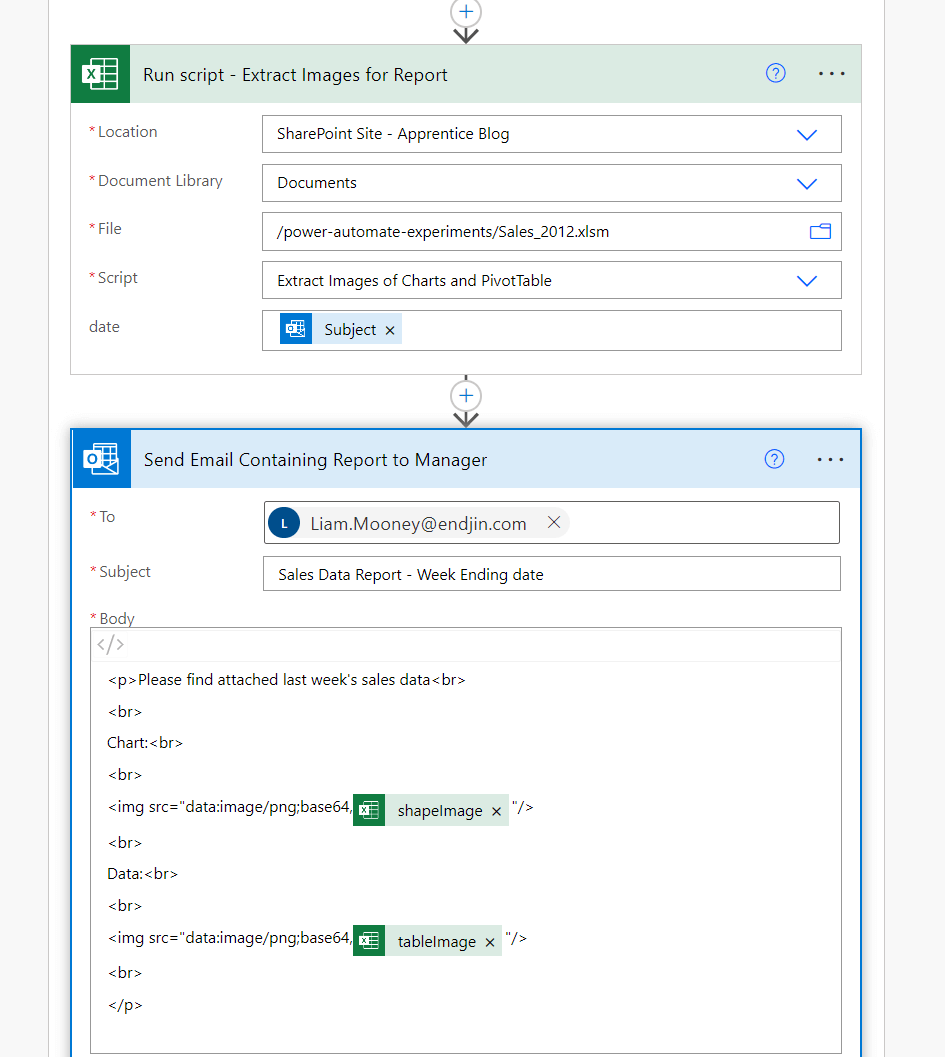
And lastly, the image above shows the final two actions from the workflow expanded. The first action is the execution of the Office Script for extracting images of the table and charts, which is being run against the primary spreadsheet. For the date parameter in that Office Script (used to filter a pivot table), the trigger email's subject is being passed as the argument, meaning, for this flow to work correctly, the manager must add the appropriate date to the subject of the email. This is a simple way of automating the flow of information from the trigger to an action, you could have a more sophisticated method that uses expressions, available in Power Automate, to extract the date from a more general email subject.
The last action is an email action, which takes the images outputted by the previous action and adds them as attachments to an email to be sent back to the manager.
This fairly simple example demonstrates how everyday manual business process can be automated with Office Scripts and Power Automate. You can imagine how this solution could be developed further to meet the demands of a more complex manual process.