Digital Asset Register


TLDR; we describe a light touch approach that enables senior stakeholders to make informed decisions about the prioritisation of investment in digital assets. This is achieved via a single page report that visualises the entire portfolio of digital assets in use across the organisation, enabling the assets to be categorised and investment policy to be developed accordingly.
We work with technology leaders in established organisations across a wide array of industry sectors. A common theme we see is the sheer volume of apps, tools, packages, platforms and bespoke software that an organisation can accrue over time. This can lead to a burden of legacy" which grows to the point where the finite technology resources and the ever increasing demands placed upon them become incompatible.
Many technology leaders struggle to manage this "burden of legacy" because they lack the insights necessary to create a plan of action to proactively address it.
In this situation, we recommend that a digital asset register is created, based on a simple high level view of the organisation's technology portfolio. This is then used to generate actionable insights that:
- Engage senior stakeholders by helping them understand the current landscape by avoiding "information overload";
- Drive an action plan to focus the finite technology resources on digital assets that are of most strategic value;
- Enable the portfolio to be reviewed regularly and plans to be adjusted accordingly.

This article provides an overview of our six stage approach.
Why do we use the term "digital asset"?
We use the term "digital asset" to draw out the useful parallels with assets in the physical world.
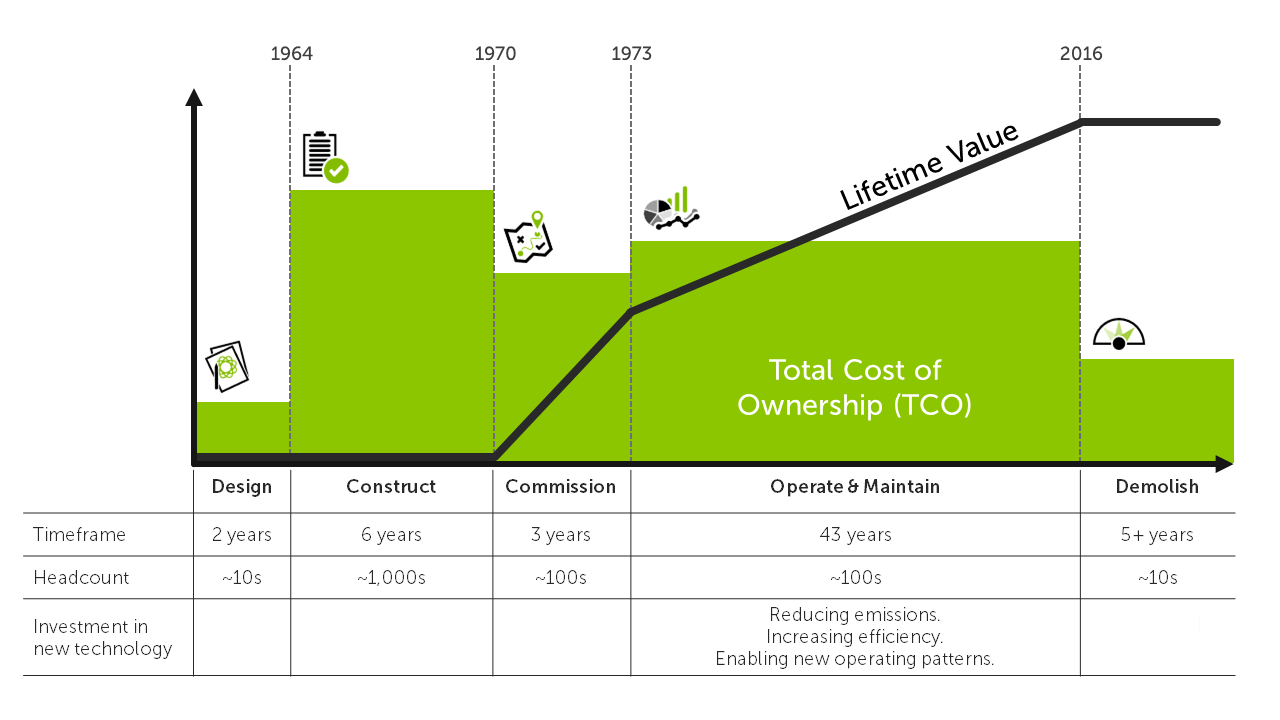
I used to work for ScottishPower, so I tend to imagine physical assets such as Longannet Power Station where I was lucky enough to be based for a year. When it was operating, it was the third largest coal fired power station in Europe, an amazing feat of engineering. It had an operational lifespan span of over 5 decades:
- Design - for its time, the station had an innovative design;
- Build - construction commenced 1964;
- Commissioning - station went operational in stages through 1970 to 1973;
- People - a diverse array of people with specialist knowledge and skills are required to operate and maintain a thermal power plant. Graduate engineer programmes and apprenticeships were established to ensure the talent pool was sustained over the full lifetime of the power station;
- Operations - the control room was staffed with operators 24 hours a day, 7 days a week;
- Maintenance - the plant had a dedicated maintenance department who were responsible for both proactive and reactive "break fix" maintenance;
- Operating costs - significant costs were incurred in running the station - buying the fuel, paying the salaries of the operations and maintenance staff;
- Investments - over its lifespan significant capital investments were made to upgrade aspects of the plant to enable it operate more efficiently, more reliably and to reduce environmental impact. For example innovations such as flue-gas desulpurisation technology were fitted to the plant to clean up the exhaust gases;
- Incidents - Longannet suffered a number of high profile operational incidents, such as the collapse of the main coal carrying conveyor in 2007 which put the station out of action for weeks. This led to my involvement in the adoption of Process Safety across ScottishPower's generation fleet, exposing me to the Swiss Cheese Model which was ultimately adapted as the basis for endjin's approach to managing cloud adoption risk;
- External forces - fluctuations in the energy market and changes to energy policy had a significant impact on the operating model of the plant in areas such as health and safety, emissions regulations and generating profile;
- Retiral - the station was closed in 2016, largely due to it being displaced by renewable technology that provided a better RoI;
- Decommissioning - given the size of the facility, the station continues to be decommissioned today, for example the 180m tall chimney stack was demolished in December 2021.
The following diagram summarises the lifetime of Longannet Power Station which spanned 6 decades:
The following video shows the 180 metre tall chimney being demolished:
It is clear to see the parallels with digital assets which also have a lifespan measured in years:
- Design - a requirements gathering and design phase to determine how to address both current and future needs;
- Build - the process of being built and tested;
- Commissioning - rolling the system out for use within the organisation, often in phases, often requiring coordinated communications and engagement of stakeholders who will use the system;
- People - attracting and retaining the specialist knowledge and skills required to operate and maintain the asset. This needs to consider churn, upskilling and retirement of staff over the full lifetime of the asset;
- Operations - staff need to be on hand to monitor and operate the asset at both the application level (e.g. data stewards) and infrastructure level (e.g. DevSecOps);
- Maintenance - capacity also needs to be set aside to maintain the asset, such as patching underlying infrastructure or rolling out upgrades;
- Operational costs - some are fixed, others can be proportional to the level of usage made of the asset;
- Investments - over the lifetime, significant investments are typically made through "projects" which commission new features to meet the evolving needs of the organisation and to take advantage of new innovations that enhance the lifetime value of the asset;
- Incidents - digital assets can also be subject to major incidents such as outages or information security breaches;
- External forces - new regulations such as GDPR can have a fundamental impact on the lifecycle of the asset. Furthermore in digital, particularly in cloud and SaaS, you may not be the party that can control events and timescales such as a vendor deciding to "end of life" product;
- Retiral - ultimately, decisions are often made to either retire the asset. In many cases it is replaced by a completely new technology or innovation that enables a better RoI;
- Decommissioning - the process to decommission a asset can be complex and expensive, for example data may need to archived or migrated.
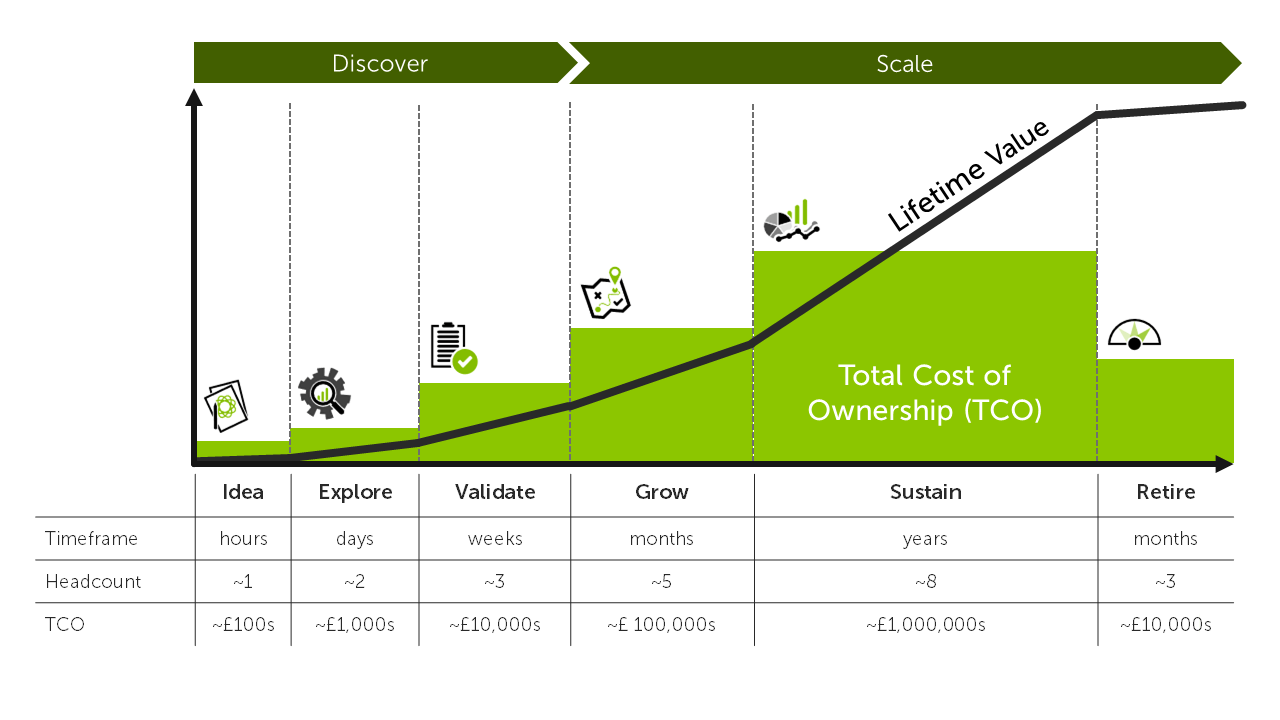
The key point is that like their physical counterparts, "digital assets" are expensive to design, build, operate, maintain, retire and decommission. When you commit to building a new digital asset, you are committing to years / decades of investment. We call this full lifecycle investment the Total Cost of Ownership (TCO).
The following diagram illustrates how TCO and total lifetime value develop over the lifetime a digital asset, encompassing the innovation phases (idea, explore, validate) where the value being generated is "validated learning":
Having a clear understanding of TCO enables senior stakeholders to avoid common traps such as the sunk cost fallacy by helping to frame important questions such as:
- How has the cost been modelled? Is this consistent with reality and the operating model we want to adopt for this asset?
- Should we invest in this asset in the first place? Will it generate sufficient business impact over its lifetime to justify the TCO?
- Which assets are generating a significant return on investment (10X or more)? How can we sustain (or even grow) this return? How can we repeat this success?
- Which assets are not generating a return on investment? Should we retire them?
- What assets are delivering business impact, but have aged to the point where we need to make a decision about retiring and replacing them?
- What external factors are at play that may force us to make a different decision regarding the road map for an asset?
- Do we have assets that are not realising their full business impact potential? Can we market use of the asset internally and / or externally so we get more value from it?
- What innovations, such as serverless, could we adopt that would enable us to reduce the TCO?
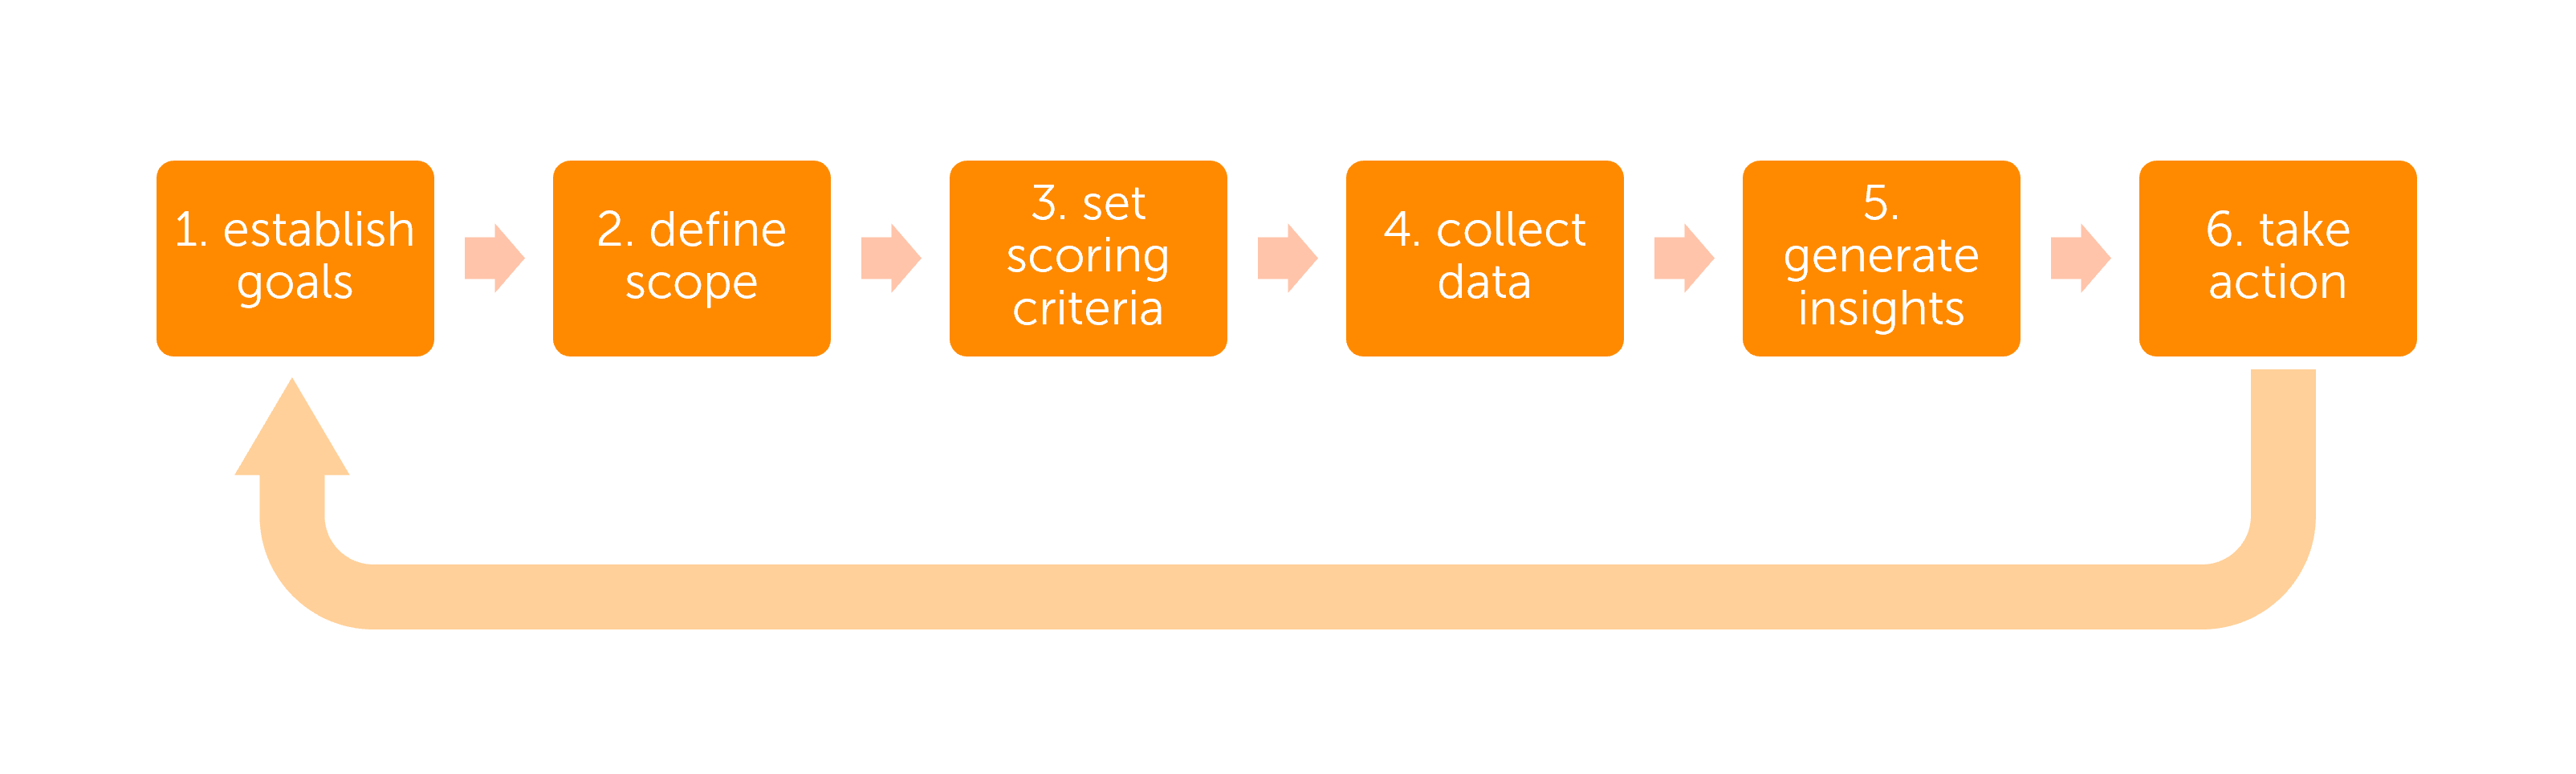
It is with these questions in mind that we apply the six stage process to create a digital asset register.
Stage 1 - establish the goals
The first stage is to establish the goals of the exercise. These goals will vary from organisation to organisation, therefore it is important to set these out up front and tailor to the approach accordingly.
In many cases, the overarching goals are likely to be establishing new governance processes that will:
- Focus the finite technology resources available to the organisation on the digital assets that have the greatest business impact;
- Ensure the digital assets are being developed and maintained in a manner that minimises TCO and risk;
- Build a better understanding of the organisation's overall digital capability and to take action accordingly. For example, upskilling through cross fertilisation of internal capability or by bringing in external experience and know-how.
Stage 2 - define the scope
The second stage is to define the scope of the portfolio to be considered. For example, you may choose to focus on all or a subset of the following domains:
- Customer / client facing technology;
- Commercial Off The Shelf (COTS) software packages;
- Bespoke software that has been developed in house by your engineering team(s);
- Bespoke tools that have been developed within the wider business - e.g. spreadsheet based solutions;
- Internal productivity tools - e.g. messaging and communications;
- Data, information and knowledge - the approach can be used to evaluate data assets as well as software assets.
We recommend that you constrain the scope initially to focus on a specific domain where you want to get immediate insights. Further domains can be added in the future once the approach has been proven.
Stage 3 - set the scoring criteria
To make the insights simple and effective, we are aiming to generate a score for each asset across two dimensions:
- Business impact;
- Technical efficacy.
To help explain what these dimensions measure, it is often useful to define the extremes, for example:
| Dimension | Worst case scenario | Best case scenario |
|---|---|---|
| Business impact | No value to the organisation | Business critical, strategically important |
| Technical efficacy | Burning platform | Solid platform that is easy to operate and maintain |

To enable scoring, each dimension should be decomposed into smaller components.
For example, the Business impact dimension can be decomposed into the following components:
- Revenue generation - does the asset contribute directly towards generating revenue for the organisation?
- Operational efficiency - does the asset enable the organisation to deliver its products / services more efficiently and to scale up confidently to meet demand?
- Risk mitigation - does the asset play a key role in mitigating risks faced by the organisation?
- Compliance - is the asset critical to enabling the organisation to comply with mandatory laws and regulations?
- Level of adoption - is the asset widely adopted by end users (staff, clients, customers)?
- Business strategy - is the asset key to supporting the long term vision of the organisation?
- End user needs - does the asset meet the expectations of end users?
- Business ownership - does the asset have a clear business owner(s) who play an active role in ensuring it achieves (and sustains) the intended business impact? Is there a roadmap in place that transcends any change in ownership?
For example, the technical efficacy dimension can be decomposed into the following components:
- Operational performance - does the asset perform reliably, or do we see a high number of support requests being raised?
- Supply chain - are the underlying software packages, frameworks, platforms and infrastructure that the asset relies on up to date? Is the Software Bill of Materials (SBOM) defined?
- Infrastructure - is the underlying infrastructure secure and scalable? Is it cost effective?
- DevOps - is the source code under source control? Are CICD processes in place? Are DTAP environments available? Are automated processes in place to deploy the application?
- Technical debt - is the asset carrying a low level of technical debt, or are there is a growing backlog of bugs, upgrades and refactoring tasks?
- Knowledge - is the asset fully documented and is knowledge about it shared by a wide range of people in the organisation, or is it undocumented and only understood by a small number of people?
- Technology strategy - is the asset aligned to the long term vision set in the technology strategy?
- Technical ownership - is the asset owned by a specific team within the organisation? Are they given sufficient capacity to proactively maintain the asset?
A set of statements are then created as necessary to assess each component. For example, to assess the "End user needs" component above we may ask respondents to score two statements:
The application provides all of the functionality that end users need.
and
The application is easy to use.
Scoring should be kept as simple as possible, we tend to use a Likert scale to drive the scoring as follows:
| Statement | Score |
|---|---|
| Strongly agree | +2 |
| Agree | +1 |
| Neither agree nor disagree | 0 |
| Disagree | -1 |
| Strongly disagree | -2 |
Stage 4 - collect the data
In order to score each of the individual components above, you will need to engage with different audiences across the organisation to generate a 360 degree view of each asset. It is useful to develop a matrix as follows to map out which dimensions and components are relevant to each audience:
| Dimension | Component | App / Product Owners | IT Operations | Engineering | End Users | Risk & Compliance |
|---|---|---|---|---|---|---|
| Business impact | Revenue generation | X | X | |||
| Business impact | Operational efficiency | X | X | |||
| Business impact | Risk mitigation | X | X | X | ||
| Business impact | Compliance | X | X | X | ||
| Business impact | Level of adoption | X | X | |||
| Business impact | Business strategy | X | X | |||
| Business impact | End user needs | X | ||||
| Business impact | Business ownership | X | ||||
| Technical efficacy | Operational performance | X | X | X | X | |
| Technical efficacy | Supply chain | X | X | |||
| Technical efficacy | Infrastructure | X | X | |||
| Technical efficacy | DevOps | X | X | |||
| Technical efficacy | Technical debt | X | X | |||
| Technical efficacy | Knowledge | X | X | |||
| Technical efficacy | Technology strategy | X | X | |||
| Technical efficacy | Technical ownership | X | X |
This matrix enables a communication and engagement plan to be developed and questionnaires to be tailored to each audience.
We use the Likert component in Microsoft Forms or an Excel spreadsheet to compose questionnaires, issue them to respondents and collect the results centrally.
Stage 5 - generate the insights
Once responses to the questionnaires have been collected, the output is consolidated and analysis is generated. For example, we load the raw output in a Jupyter notebook to wrangle the data into a structure that is suitable for analysis in Power BI.
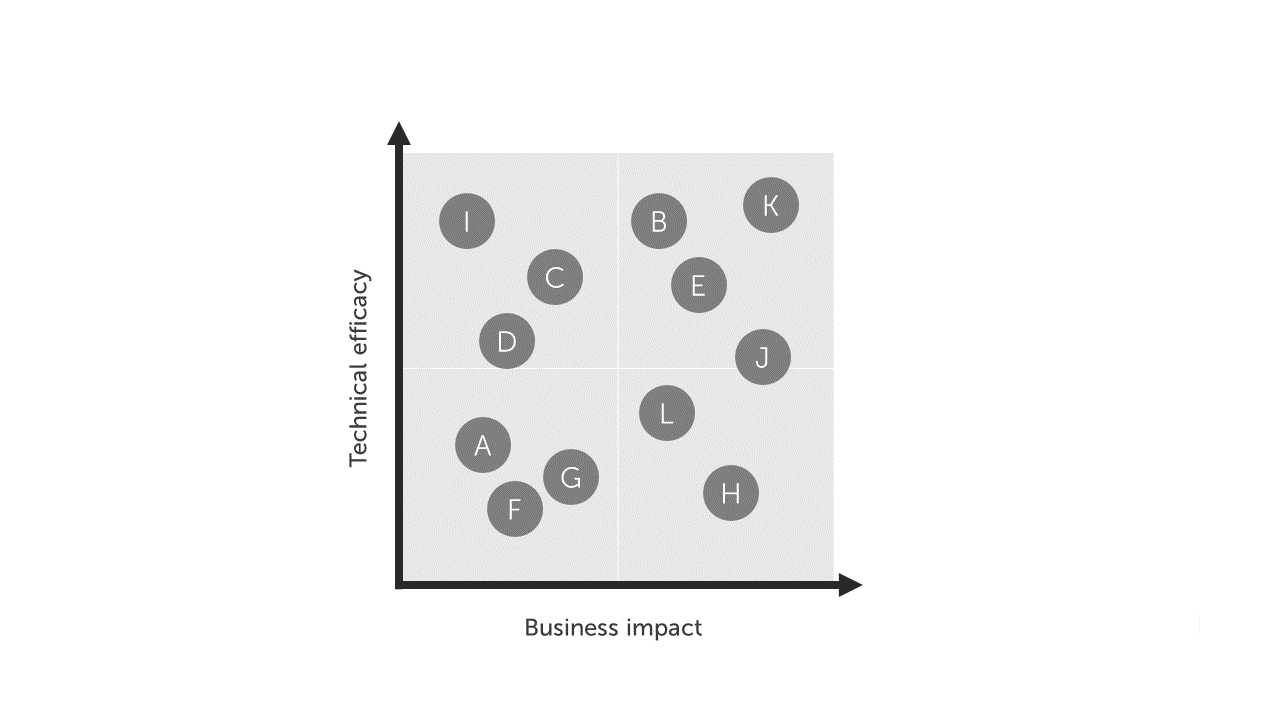
The key insight is achieved using a scatter plot in Power BI which plots each asset as a point where:
- The vertical axis is defined by the averaging the score across returned by respondents for all statements related to the technical efficacy dimension;
- Horizontal axis is defined by the averaging the score across returned by respondents for all statements related to the business impact dimension.
This leads to a visualisation as follows:
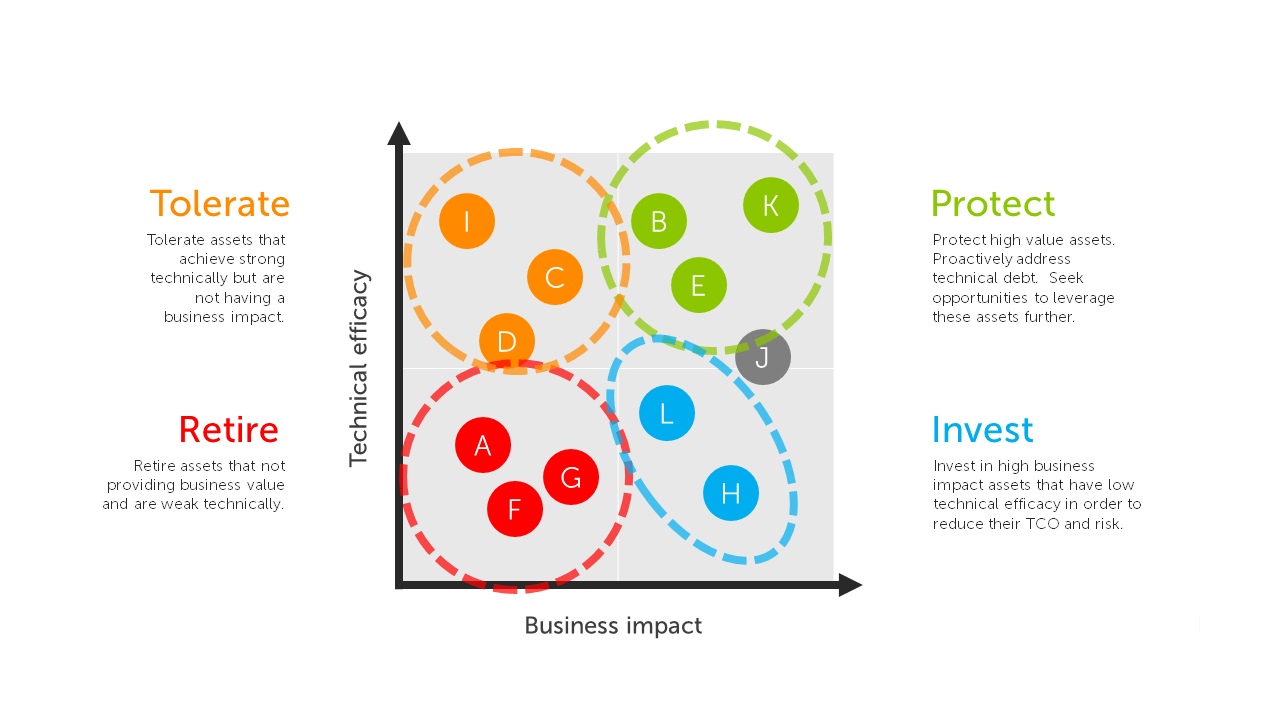
This then allows you to identify classify clusters of assets as follows:
Stage 6 - take action
This analysis should be reviewed regularly with senior stakeholders. A policy should be adopted based on the classification of the assets based on a set of principles as follows:
- Protect high value assets. Ensure that technical debt is being proactively addressed. Understand what factors that have led to these assets being a success, seek to apply these to the wider portfolio;
- Invest in high business impact assets that have low technical efficacy. Seek to lower the TCO, and address technical debt that could put the business value they generate at risk;
- Tolerate assets that are strong technically but are not having a significant business impact. Challenge application owners to find ways to generate more value from these assets;
- Retire assets that not providing business value and are weak technically. Seek to release budget that can be redirected to higher value assets.
We find that this leads to strong engagement from stakeholders, a greater situational awareness being developed and to tangible action being taken, for example:
Assets that fall into the "protect" category are effectively your crown jewels. It does no harm to remind senior stakeholders what these are! We also find that stakeholders will be interested in what has led to these specific assets achieving this level of success. This is a fantastic opportunity to highlight common themes across these assets that have driven success such as the adoption of a "cloud first" architecture, the performance of a specific engineering team or where a "business led" approach has been adopted;
Assets that fall into the "invest" category raise awareness of the business critical assets that have been allowed to fall into disrepair. This often leads to a positive outcome where stakeholders agree to prioritise the budget necessary to restore these asset to a more solid footing. We also find that stakeholders will raise questions about what has led to this situation. This is an opportunity to highlight the need for sustained investment in these assets rather than a "one time fix" approach - in other words a "products not projects" approach to managing the technology strategy and budget;
Where an asset falls into the "retire" category, the next action should be to give the business owner(s) an opportunity to make a case to retain it. In many cases we find that they will struggle to provide sufficient evidence to make such a case and will agree to the asset being retired. Once a "retire" decision has been made, budget will need to be set aside to "end of life" the asset and the associated products or services, which could be significant. However, once implemented, the budget released by the decommissioned asset can be reinvested in higher value assets in the portfolio;
Finally where an asset falls into the "tolerate" category, the next action should be for business owner(s) to develop a plan to drive more business value from it. In many cases this can put impetus behind wider adoption of the asset, but if it fails to achieve this a decision to "retire" can ultimately be made.
The "retire" and "tolerate" categories enable you to cut through personal motivations to make decisions that will benefit the organisation as a whole:
"It is difficult to get a person to understand something, when their salary depends on them not understanding it." Upton Sinclair
Final thoughts
We find that this high level, clinical view of the estate, where everything is measured equally, is a hugely valuable lens. It helps to shift the conversation with senior stakeholders, by providing a level of situational awareness that enables them to become more actively involved in making top down, dispassionate, strategic decisions about digital assets.
The process is light touch and repeatable, giving technology leaders an opportunity to engage stakeholders on a regular basis (we recommend every quarter) to continue to generate actionable insights and to track execution of the action plan.
We also recommend that stakeholders are involved in setting an overall vision by setting objectives of where the organisation is aiming to get over the next 12 to 18 months. This could include:
- Application rationalisation - setting a target for the number of digital assets that the organisation is willing to own and operate;
- Setting clear policy regarding technical debt - a set of principles concerning the level of technical debt that the organisation is willing to carry.