Event stream manipulation using Rx – Part 1

In a previous post I started talking about semantic logging and using the ETW and Tx technologies to assist in doing that.
ETW and the EventSource package enable you to write trace events directly to tracing sessions and the Windows Event Log. Tx builds on Rx and LINQ to allow querying of raw event sources such as the Windows Event Log.
This blog post continues along that line of thinking, by using Rx to process the messages received from Windows Event Logs, so that they can be shaped in a way that is useful to us to consume.
First I'll introduce the observer pattern and a framework called Reactive Extensions (Rx) which implements the observer pattern.
At a high level, I'll cover what Rx is and how to use it. We'll introduce what marble diagrams are and how to use them to visualise sequences of events.
In Part 2, I'll attempt to construct a concrete example based on the ideas in the semantic logging post and this one, in a potentially useful scenario!
The observer pattern
In .NET 4 Microsoft introduced the IObserver<T> and IObservable<T> interfaces.
These interfaces give you a generic way of providing push-based notification, which is also known as the observer pattern.
The provider (IObservable<T>) must implement a Subscribe method, which lets the caller indicate it wants to receive push-based notifications.
The caller passes an instance of the observer. The observer (IObserver<T>) must implement three methods (OnNext, OnError and OnCompleted) which the provider calls to send different kinds of notifications.
For slightly more detail and some simple examples, take a look at the interfaces for IObservable<T> and IObserver<T> in the msdn documentation.
A quick and high level overview of Rx
The Reactive Extensions libraries from Microsoft provide implementations of the interfaces outlined above.
Rx uses LINQ to allow incredibly powerful but simple and declarative solutions to complex problems, when dealing with sequences of events.
It is available as a number of different packages on NuGet. To install them all, look for Rx-Main.
There is also an "Extensions for Reactive Extensions" package available on NuGet, called Rxx. This provides many more useful Reactive LINQ extensions that aren't in the main Rx library from Microsoft.
Marble diagrams
Before we go any further, let's discuss marble diagrams, as I'll be using them to demonstrate sequences of events through this post.
These types of diagram are frequently used in videos and blogs, including those from the Rx team themselves. They help to visualise streams of events and how they are manipulated over time and are useful for explaining how different operators in Rx work.
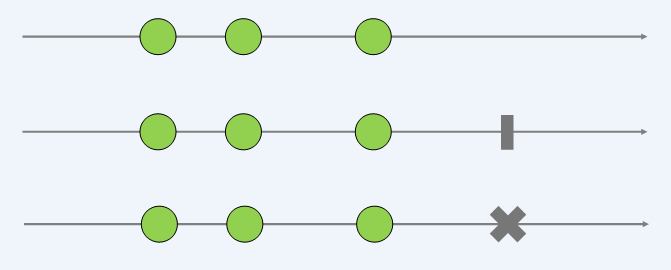
Figure 1 – Marble diagram of a simple streams of events
Figure 1 shows the simplest representations of an observable stream of events.
Each horizontal line represents a single observable stream over time i.e. as you move along the line towards the right, time is passing.
The green circles represent a single new event (on next). The vertical line represents a successful end to a stream (on complete). The cross represents an exceptional end to a stream (on error).
Therefore, the first stream in Figure 1 has had 3 events and is still running.
The second stream has had 3 events and has successfully finished.
The third stream has had 3 events and has ended with an exception.
Let's expand from the simplest form of the marble diagram and look at one that performs some data transformation on the event stream.
var streamOverTime = Observable.Interval(TimeSpan.FromSeconds(1));

var squaredStreamOverTime = streamOverTime.Select(value => Math.Pow(value, 2));

squaredStreamOverTime.Subscribe(Console.WriteLine);
This is a simple snippet of code (if you wish to reproduce, it is a console application and the Rx.Main NuGet package has been added).
An observable is created that produces a value every second. Each value is projected to be it's own square inside the Select operator.
We subscribe to the observable and for each event simply write the output to the console window. This is what the output of the program looks like:
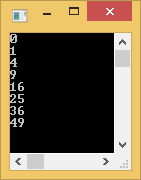
Figure 2 – Console output for an Rx observable that samples the square of the number of seconds every second
We could visualise this stream of events and what the Select operator is achieving with a marble diagram like this:
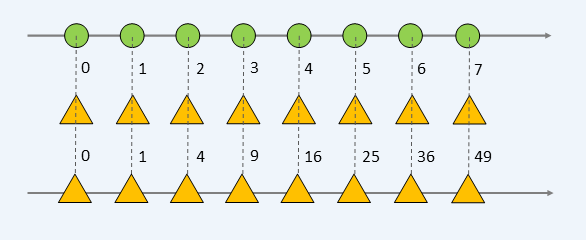
Figure 3 – Marble diagram of a Select operator
The top line shows the raw stream of events over time. This is the input.
The bottom line shows the processed stream of events over time. This is the output.
Moving between the two lines shows any operations on that event. In this example we are performing a Select operation and project the given value to be the square of itself.
Slightly different to the simple examples above, the yellow triangles on the bottom output line represent the "on next" calls.
The actual input and output values are also given on this diagram to make things as obvious as possible.
This provides a clear and very visual way of thinking about this stream.
Now imagine if there were many inputs combining in different ways (for example there would be more than one line of input streams, merging into one output line), or multiple steps of processing (so there would be multiple lines in the middle).
Being able to visualise these complicated interactions becomes very important. We'll see some more complex examples as we progress.
Visualising some Rx operators
I don't want to go into too much detail about how to use Rx in this post, as that could fill a whole series by itself!
I would highly recommend the Introduction to Rx site as this starts at the very beginning and has a lot of examples and detail.
There is also a site listing 101 Rx samples which can provide a useful reference for actually using Rx code in various scenarios.
What I do think would be valuable is going through some of the common Rx operators and drawing marble diagrams to help you visualise what they are achieving.

Many Rx operators could be grouped into similar categories for their type of usage. For example there are operators for reducing, aggregating, combining and time-shifting to name but a few.
Filtering a stream could take the form of a Where clause or skipping events given a condition (e.g. the Take or Skip operators). Let's visualise another simple sequence of events, which has been filtered using a Where clause:
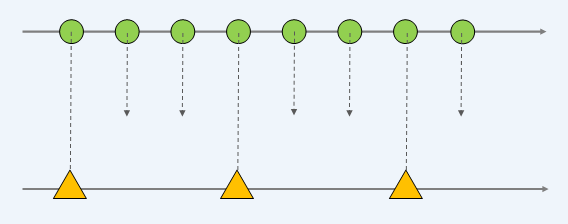
Figure 4 – Marble diagram of a Where operator
In the next diagram we have two input sequences: 'a' and 'b'. The observable we subscribe to is defined as a.TakeUntil(b).
Looking at the diagram, this reads as return the events from sequence 'a' until sequence 'b' produces a value.
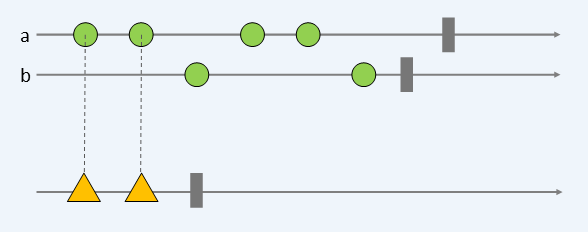
Figure 5 – Marble diagram of TakeUntil operator
Aggregating a stream could be counting the number of events, computing the sum of a sequence, or only taking the event from a sequence with the maximum value.
Many of these different types of aggregation could be represented using the same marble diagram. For example the next diagram could potentially be for any of Count, Sum, Aggregate, Min and Max among others.
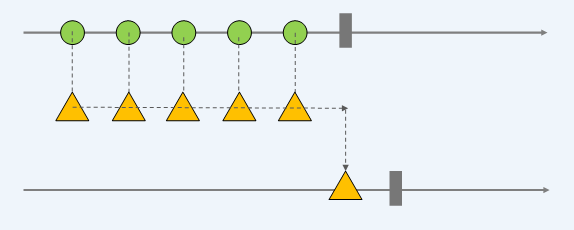
Figure 6 – Marble diagram of aggregation operators
Grouping operators allow you to partition a sequence given some selector function. The result is an observable of grouped observables, so you would subscribe to the result sequence and then further subscribe to any or all groups that you are interested in.
As a simplistic example, imagine a single input sequence of different shapes: circle, square and triangle.
The output sequence will be an observable containing three grouped observables, each containing the events for that specific shape. Let's visualise it!

Figure 7 – Marble diagram of GroupBy operator
Combining sequences is all about taking two or more input streams and converging them into a single output stream.
Concat is probably the most simple way to compose multiple streams. It is a way of combining streams sequentially. Given two streams, listen to the first until it completes then subscribe to the second.
If either sequence were to fault, the result stream would also be faulted.
It is possible to pass an IEnumerable<IObservable<T>> to concatenate multiple observable sequences into one in a lazy way (lazy here meaning lazy evaluation!)
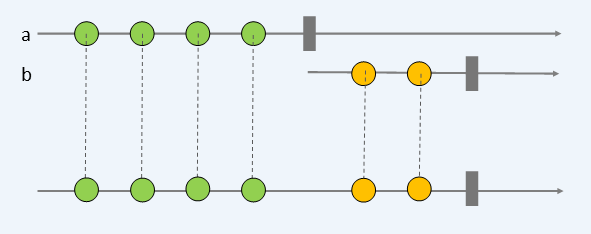
Figure 8 – Marble diagram of Concat operator
Merge is an example of an operator that merges streams concurrently. Given any number of input sequences of the same type of event, any event is pushed to the resulting sequence as it occurs.
The result stream will only complete when all subscribed inputs are complete. It will error if any one of the inputs errors.
Compare this diagram to the one for GroupBy above. GroupBy takes an input sequence and allows you to split the result, whilst Merge takes multiple input sequence and allows you to merge the result.
This opposite behaviour is reflected in the diagrams.
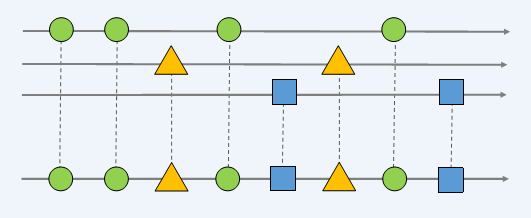
Figure 9 – Marble diagram of Merge operator
The last way of combining sequences that I'll demonstrate is Zip, although there are plenty more! Zip functions in the same way you probably imagine it – like a zipper.
Given two input streams, it pairs the events before pushing to the output stream. Thus, the rate of output is determined by the slower of the two streams.
In this diagram the first sequence produces 5 events, the second only 3 and the output also produces 3. The result is a complex type composed of the two events, and completes when one of the inputs completes.
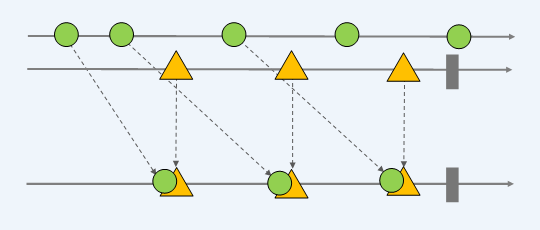
Figure 10 – Marble diagram of the Zip operator
Time shifting events in a sequence is the final concept I'll introduce in this particular post. When observing a stream of events, you most likely don't know exactly when the next event will come in.
It is possible to buffer events up into batches by time or count, delay a sequence by a length of time or until a certain time, sample or throttle a sequence to only pick out certain events (e.g. if the number of events is vast and you only really care about taking note of one every minute).
Again, there are many other possibilities I have not mentioned here. Let's draw marble diagrams for a couple of these scenarios:
Buffering allows you to work with batches of data.
You might want this because you need to do some further processing that you need a number of events to achieve, or perhaps it is too computationally expensive to process them one by one.
There are different types of buffer, for example those that overlap - this type could also be described as a rolling window.
The following diagram depicts an overlapping buffer, buffering by a count of 3. The result stream is an IObservable<IList<T>>, so when you subscribe to it you get a series of lists, rather than individual items.
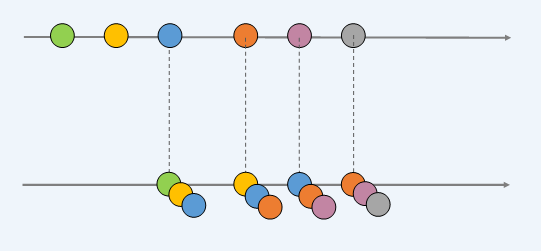
Figure 11 – Marble diagram of the Buffer operator
The Sample operator will return you the last value for a defined period of time, for example you want to sample one event every minute.
The Throttle operator is an interesting one. Like Sample it returns you the last event in a period of time, however, with Throttle that time window resets every time a source event is received.
This means for sources with a constant rate of events produced, it is possible that none would ever be pushed to the resulting sequence.
At first glance this might seem like an odd behaviour, but it can be useful in scenarios where the input rate is variable and you need to take advantage of that.
For example, imagine you have an input field and are gathering data typed in by a user.
You only want to start processing that input when the user stops typing for a set period of time. That way you aren't calculating results needlessly, but can still give the user a responsive experience.
Using Throttle, this becomes almost trivial to implement!
In this diagram the dotted lines above the source stream represent the resetting time window.
The red dotted line shows the length of time needed to be reached to publish the last received event.
Only at one point in the source stream is there a gap in events long enough for the last event to be pushed to the result stream.
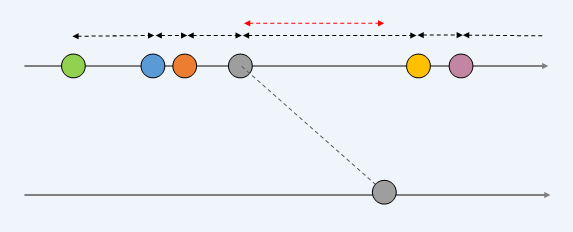
Figure 12 – Marble diagram of the Throttle operator
Putting it all together in a concrete example
Part 2 will implement a real example, making use of the ETW, Tx an Rx technologies. There are more code samples of Rx in action and more complex marble diagrams.

