A Short Tale of a Deceptively Slow LINQ Expression


With any good iterative development process – the first step is to get something working: solve the problem in as simple a fashion as possible, then refactor. Part of the refactoring consideration should be an initial performance monitoring spike to see which parts of your codebase are running slow.
Once I had the initial prototype of Templify working I decided to performance profile it – as I was aware that the package creation and package deployment processes were taking quite a bit of time, not an exceedingly large amount of time – as it was doing considerable work: lots of IO tasks – scanning and copying folders and file, reading and modifying file contents, creating archive files etc.
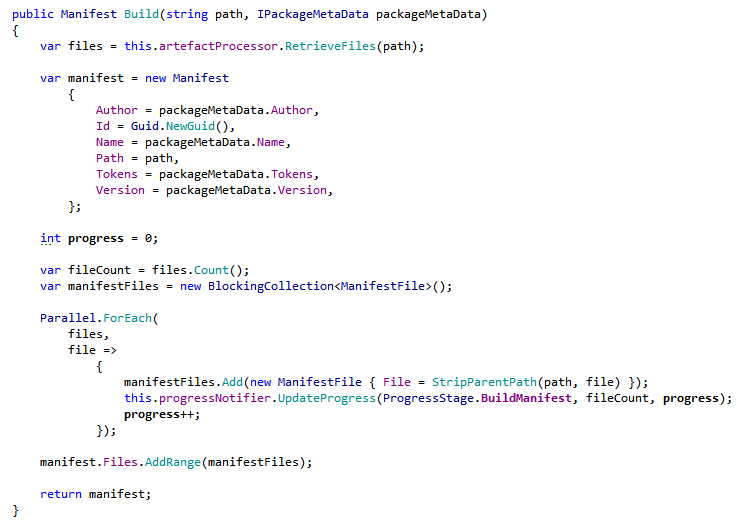
One of the first performance hotspots highlighted was the following piece of code that create the Templify manifest – the list of files that make up the template:
My mantra for performance optimisation spikes is MAM: "Measure, Alter, Measure" – the above code took 213 seconds to run against my test harness (the Sharp Architecture 1.6 release). Initially I thought that 3.5 minutes wasn't an unreasonable amount of time – and the code is trivial – it's looping around a collection of files, doing some string manipulation, adding a result to another collection and raising an event. Thinking about it some more – there is no way that such trivial code should take that long – so there had to be something else going on.
Then I suddenly realised that it was a problem with the LINQ extensions – they were being evaluated on every iteration of the loop – firstly the outer foreach and then the inner files.Count(). I made one simple refactoring to force evaluation of the collection (rather than being deferred) and calculating the total number of items up front rather than repeatedly in an adhoc manner:

I measured the code running against my test harness for a second time – the method now executed in 84 seconds. Such a small change caused an overall saving of 129 seconds.

The lesson to take away is that just because code is simple, doesn't mean it performs well. LINQ exposes simple extension points that mask deceptively complex inner workings that can have hidden performance penalties if used incorrectly.

For those who are interested - my tool of choice for Refactoring is ReSharper and my tool of choice for Performance Profiling is dotTrace.