Table Functions in DAX: DISTINCT


We have seen in my previous blog post that table functions are functions in DAX that return a table. This blog post will explore one of the most common table functions – DISTINCT.
DISTINCT
DISTINCT (column) accepts a column reference as a parameter and it returns a one-column table that contains all of the distinct (unique) values of that column as visible in the current filter context. Put simply, duplicate values are removed and only unique values are returned. If there are any blank values in a column, DISTINCT will exclude them. When used in a measure, the DISTINCT function must be used in conjunction with another function that counts, filters, or aggregates the returned distinct values.
In this blog post I will be applying measures to a simple Power BI report to demonstrate how DISTINCT operates. The Power BI report contains two tables – Sales and Product. The Sales table shows all of the sales that have been made of various different products:
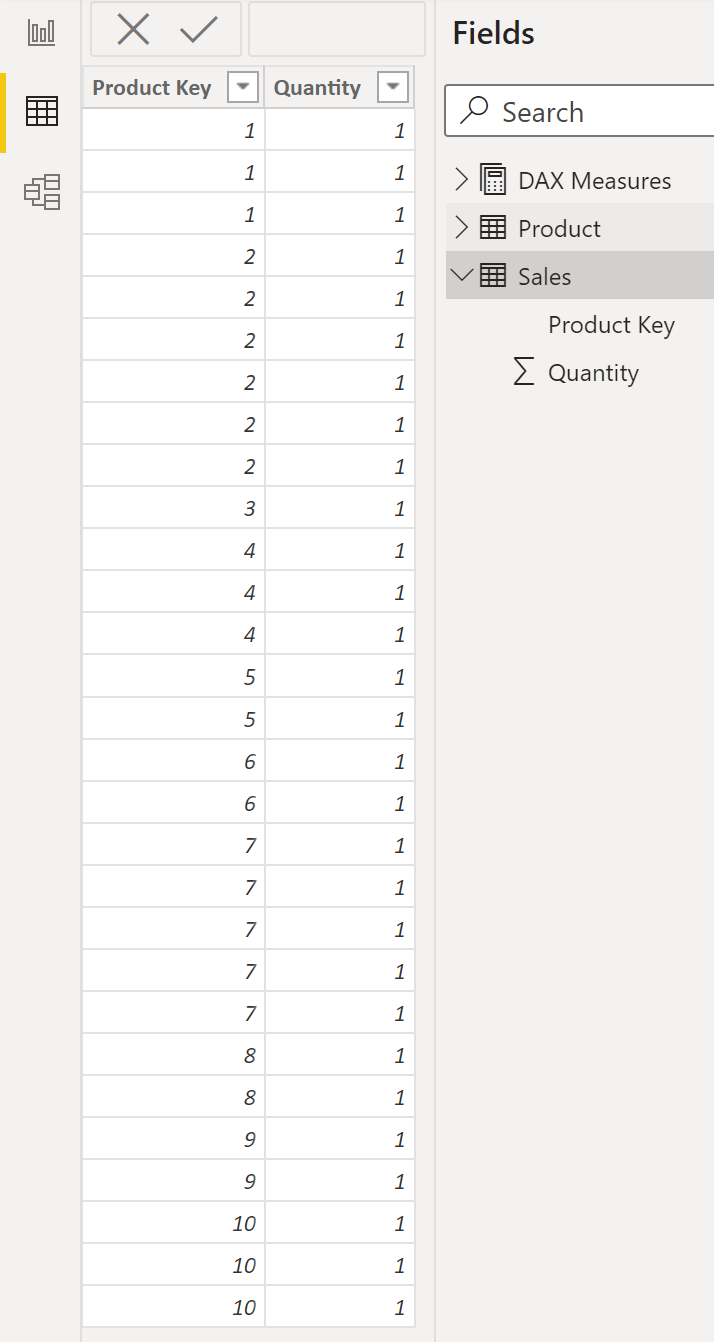
Now, let's create a measure using DISTINCT. The following formula uses DISTINCT with the COUNTROWS aggregation function to count the number of unique products that have been sold:
Products Sold = COUNTROWS ( DISTINCT ( Sales[Product Key] )
DISTINCT returns all of the unique values of the ‘Product Key' column in the Sales table shown above. The aggregation function COUNTROWS then counts the number of rows that are present in this table. The result of this calculation when the measure is applied to a table visual alone is 10. As there are 10 distinct values in the ‘Product Key' column of the Sales table.

We also have another table in the report, Product, which contains information about the product colour:

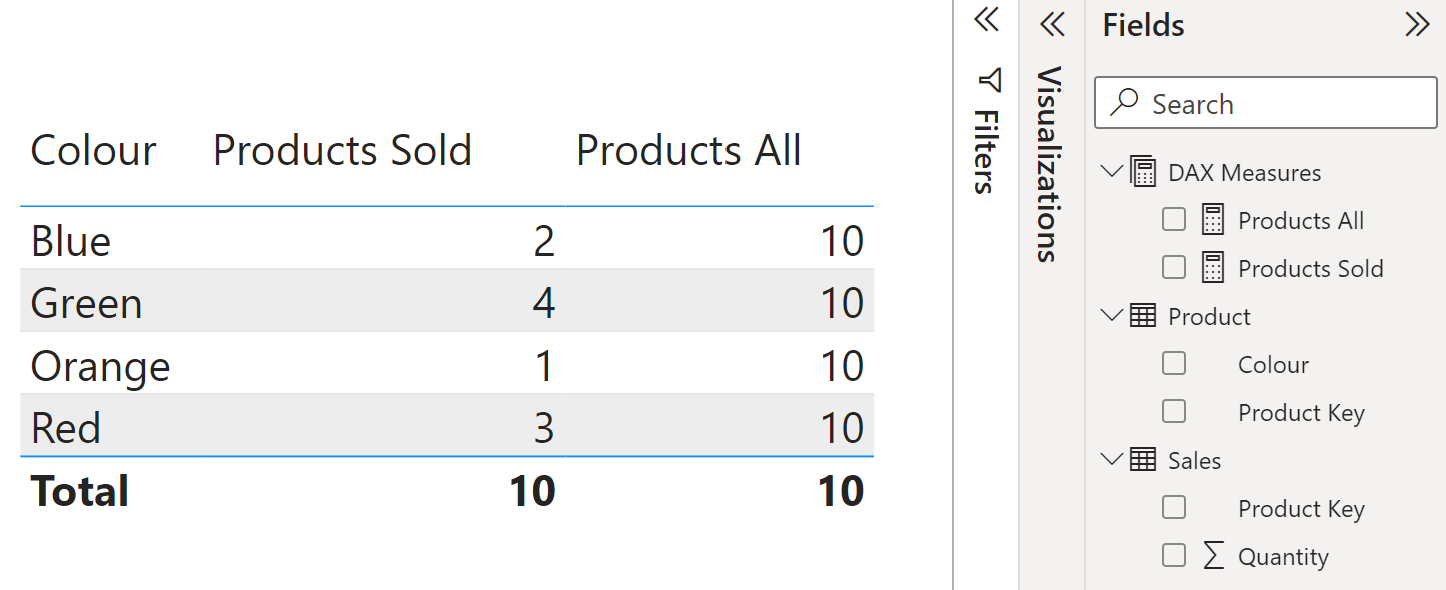
When the ‘Products Sold' measure is applied to a table visualisation containing the column ‘Colour', we will be able to see how many unique products we have sold of each colour. DISTINCT will obey the filter of ‘Colour' we have coming from the filter context of the report, and will use this when evaluating the formula. So the unique values that are returned and counted are only from a filtered sub-set of values. For example, in the row where the ‘Colour' is ‘Blue', the ‘Product' table will filter the ‘Sales' table to only include ‘Blue' products i.e. only the sales of products 4 and 5. DISTINCT will adhere to this filter context when returning the unique values of the ‘Product Key' column. So the number of unique values returned by DISTINCT is 2. We have sold 2 different products which are of the colour blue.

(Side note: Although this blog post has focused on the DISTINCT (column) table function, it is important to mention here that DISTINCT also accepts a table reference as a parameter. If the parameter for DISTINCT is a table expression, the result is a table with the same columns but with duplicated rows removed.)

DISTINCT vs. ALL
DISTINCT has similarities to the ALL table function covered in my previous blog post, but there is a key difference between the two. ALL returns all the values of the column passed as a parameter, regardless of any filter. On the other hand, as we have seen, DISTINCT obeys any filter and returns only the values which are visible in the current filter context.

Let's create another measure to illustrate how ALL operates in comparison to DISTINCT:
Products All = COUNTROWS ( ALL ( Sales[Product Key] ) )
If we supply ALL a column name as the parameter, the function returns a calculated table with one column which contains every distinct value from the column passed as the parameter. Applied to the table in the report, for every colour, we should always see the same number. This is because ALL ignores the filter of ‘Colour' coming from the filter context. The number we see on every row is telling us that in total, across all sales, we sold 10 different (unique) products.
Conclusion
In this blog post we have seen how the DISTINCT table function returns all of the distinct (unique) values of column or a table within the current filter context. We have seen how this contrasts with the table function ALL. ALL returns a distinct list of values from a column without regard to the current filter context.