ArrayPool vs MemoryPool—minimizing allocations in AIS.NET

This post describes how we discovered, diagnosed, and then fixed a memory allocation related performance issue in a .NET component designed for high-volume, high-efficiency processing of location data.
Earlier this year we published our high-performance AIS.NET library. (The source is on GitHub, and the binaries on NuGet). AIS, the Automatic Identification System, is the standard means by which ships and other vessels constantly transmit their location, speed, bearing, and related information. If you want to work with location data for shipping, you need to be able to handle AIS messages.
We were working on an application that needed to process very high volumes of AIS data at low cost. When we reviewed the existing options, none offered the efficiency we were looking for, and the level of support for the messages types we wanted wasn't great, so we set out to write our own parser.
When processing high data volumes on .NET, it's important to minimize the amount of work created for the garbage collector (GC), so one of our goals for this library was to perform zero allocations per message once up and running. (See the launch blog for details of how we use the memory efficiency features added in C# 7, and .NET's associated Span<T> type to achieve this.) When we recently updated the benchmarking for some new usage scenarios, we discovered cases in which we didn't quite reach this goal. The effect on performance was small in practice, but we wanted to understand what was happening.
This blog describes how we investigated the issue, and what we did to improve efficiency in these cases.
Investigating the extra allocations
We noticed a discrepancy between test results on .NET Core 2.1 and .NET Core 3.1. The project for which we originally developed this library ran on .NET Core 2.1, so our performance testing focused on that runtime. Microsoft has committed to supporting .NET Core 2.1 through until August 2022, and we are following suit in AIS.NET, but with .NET Core 3.1 having displaced 2.1 as the latest LTS release, 3.1 is now the more important runtime. When we modified our benchmark tests to focus on .NET Core 3.1, BenchmarkDotNet started reporting that each test run was allocating over 13MB of memory, compared to the 3.63KB we saw on .NET Core 2.1.
Worse, whereas that 3.63KB on .NET Core 2.1 did not change as we adjusted the message count in the tests, the memory consumption per test on .NET Core 3.1 went up if we increased the message count. We had lost the important characteristic of being able to reach a state where no new allocations occur no matter how many more messages we process.
It's worth noting that this wasn't having a particularly large impact on performance. (The changes we ultimately made improved the benchmark's memory numbers, but the effect on throughput numbers was barely visible through experimental noise.) Nevertheless, unnecessary allocations can cause problems for other code. Also, for AIS applications, embedded operation may be important, which means we want to run efficiently on low-powered devices. So we felt it was worth changing this.
The first question was: what exactly is being allocated here? BenchmarkDotNet will tell you how much memory each test run allocates, but tells you nothing about what's in that memory. (It doesn't report memory information by default by the way. The line of code here enables this feature.) There's a lot of good writing out there about investigating GC-related performance issues, especially from Maoni Stephens, but it turns out that the first question we wanted to answer was a bit too basic to be covered by that sort of guidance:
We just wanted to know what kinds of objects are being allocated.
Most of the existing GC performance analysis documentation takes a system-wide approach (including asking whether GC is even an area you need to focus on), which is the right approach for most applications. In fact, the reason our issue had gone unnoticed is that in the application for which we designed the library, this issue has minimal practical impact. But we were in a situation where a microbenchmark caused a much higher rate of allocation than expected, and we wanted to know why—even though there wasn't a performance problem in a live system, we had code behaving in a way we did not understand, which was troubling.
As it happens, Visual Studio offers tools that can answer this kind of basic GC question. If you open its Performance Profiler window (from the Debug menu, in editions that offer this feature) one of the tools it offers is ".NET Object Allocation Tracking". This can tell you what mix of object types you have on the heap, where they were allocated, and how long they lived. That's exactly what we needed.
However, BenchmarkDotNet puts a hurdle in your way. If you have a benchmark project and you attempt to use Visual Studio's performance analysis tools on it, you'll be disappointed. It turns out that by default, BenchmarkDotNet runs everything in separate processes. In fact, it even builds its own temporary projects to host the code under test.
There are good reasons for this—it enables the tool to run tests against multiple different frameworks for example. However, it makes life quite awkward if you're trying to use diagnostic tools that will launch the process under test. (Most tools can also attach to an already-running target, but this is fiddly and error-prone, and with profiling you can end up missing out important measurements. It's typically better to have a process that automatically does what you need.)
To enable single-click launching of profiling operations, we have added a single-process mode to our benchmark project. BenchmarkDotNet has built-in support for this, you just need to ask for it. You can see the code for this here.
With that in place we were able to run the benchmark project with Visual Studio's .NET Object Allocation Tracking tool, which produced this result:
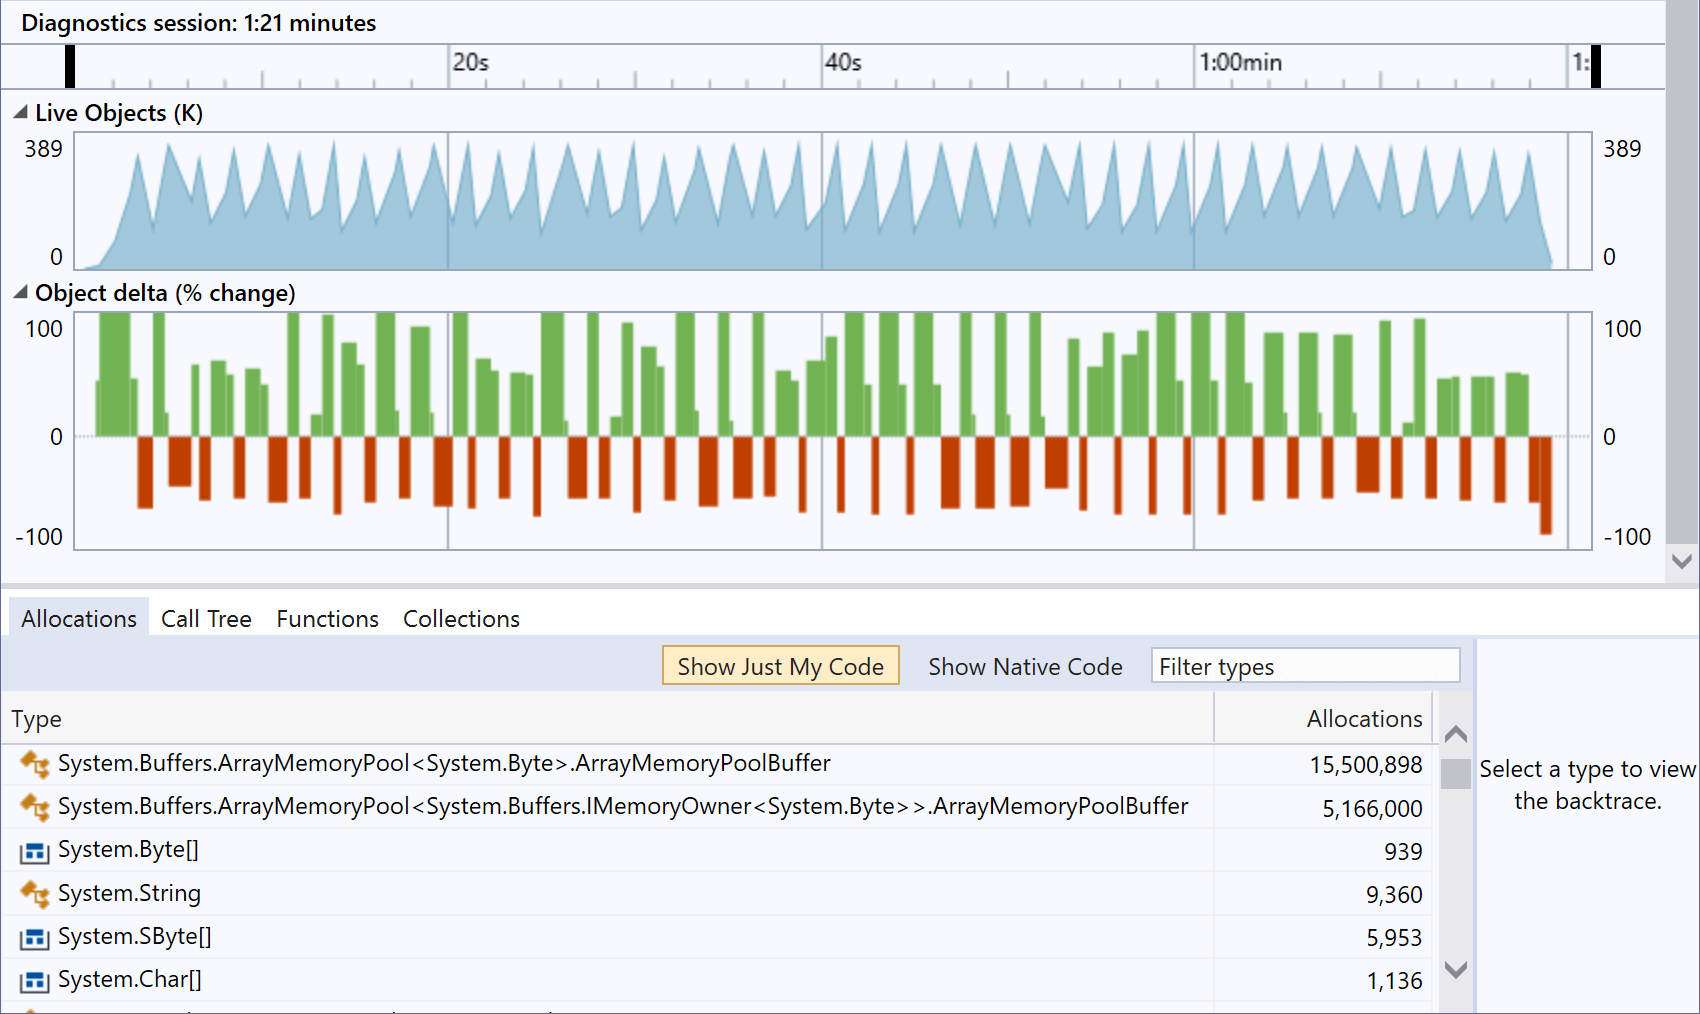
The "Live Objects" part of this view shows the typical 'sawtooth' pattern you get when a program performs lots of allocations—the number of objects on the heap climbs until the GC steps in, and frees a load of them, over and over again. This is exactly what we don't want to see in a library designed to minimize the number of allocations. All of that up and down movement in the graph shows that we've created exactly the kind of GC work that we're trying to avoid.
This has also shown us what kinds of objects are being allocated, with the two main culprits both being variations on ArrayMemoryPool<T>.ArrayMemoryPoolBuffer. (By the way, some of what you can see in this view comes about because of how BenchmarkDotNet operates. For example, it executes the test many times over to minimize spurious results caused by random transient external effects, and it forces a GC between each run when you ask it to monitor memory usage, which can change what you see in this sort of view. And quite a lot of the allocations we see here come from BenchmarkDotNet itself. You can mitigate that second problem by selecting a section of the timeline during which only your test code was running.)
The root cause of the extraneous allocations
So now we know that most of the allocations here are a couple of variants of a particular generic type, what can we learn from this? Our code doesn't use ArrayMemoryPool<T> directly, but it does use MemoryPool<T>, and it turns out that the MemoryPool<T>.Shared property returns an instance of ArrayMemoryPool<T>. We're using this in an attempt to reduce allocations, so it's somewhat galling to learn that it's causing them.
The idea behind MemoryPool<T> is that if your code needs to allocate blocks of memory (such as arrays) regularly, you might be able to reduce pressure on the GC by reusing those blocks instead of allocating new ones every time. Each time you need some memory you can call MemoryPool<T>.Rent instead of instantiating an array. When you've finished with that memory, you can return it to the pool, and then the pool might hand out the same array the next time some code asks for one. The reason AIS.NET needs to create arrays from time to time is that AIS message can get split up into fragments, and you don't necessarily get the next fragment of the same message immediately—messages can become interleaved. So we need to hold onto fragments until we've got the whole message, and we may find ourselves in a state where we've got data from multiple partial messages, all of which are not yet complete. Moreover, we don't know what order they will complete in—it won't necessarily be the order in which they started to arrive. Our parser allocates memory to keep track of message fragments until we've got whole messages. And, because our message-type-specific parsers required data to be contiguous, we also allocate memory to reassemble the fragments before parsing them. The number of messages likely to be in progress at any one time is small. (It's also bounded, because we impose a limit on how long we wait for the remaining fragments to turn up, to avoid leaking memory in cases where fragments were lost in transmission and are never going to arrive.) So an array pool is exactly what we want—once it has grown to the size we need we can just keep on reusing the same arrays over and over again.
So in theory, the MemoryPool<T> was meant to help us get to zero-allocations-per-message once we're up and running. What went wrong?
The problem lies in an undocumented aspect of the pool's implementation. A MemoryPool<T> hands out objects that implement IMemoryOwner<T> and this offers two benefits over returning arrays directly: 1) IMemoryOwner<T> inherits from IDisposable, meaning that when you're done with the memory you can just call Dispose to return it to the pool and 2) it presents the memory as a Span<T>, making it possible to implement a MemoryPool<T> that doesn't use the .NET heap at all—it means that the blocks of memory it provides do not necessarily have to be arrays. (That second point is for advanced and unusual scenarios; it can be useful if you need to interoperate with some non-.NET API.) This is all very helpful but it does mean that any MemoryPool<T>.Rent implementation is going to have to return you an object that lives on the heap, because interface-typed references always refer to heap-based objects. (Although a struct can implement an interface, the CLR will create a boxed copy on the heap each time you obtain an interface-typed reference to a value of that type.)
Since MemoryPool<T> is all about minimizing GC through reuse, I had presumed that these objects implementing IMemoryOwner<T> would be recycled in exactly the same way as the blocks of memory they represent. In fact, it turns out that with the particular implementation returned by MemoryPool<T>.Shared, every time you call Rent it allocates a brand new object implementing IMemoryOwner<T>. This makes one very useful feature possible: each individual object can remember that you've disposed it, and throw an exception if you attempt to use it after disposal. (If these objects were recycled, there'd be no way to detect that.) However, it does mean that MemoryPool<T>.Shared turns out to be a poor choice for small arrays of the kind we require in AIS.NET. If you're using big arrays, then the wins from buffer reuse are large, and the cost of allocating the very small IMemoryOwner<T> implementation is a price worth paying. But as your buffers get smaller, the cost of that object starts to get more significant. (As it happens, it's still a net win for us: we'd be allocating at a much higher rate if we just constructed new arrays every time. It just means that when we encounter message fragmentation, we no longer achieve our zero-allocation goal.)
Why don't we see the problem on .NET Core 2.1?
With hindsight it's a bit of a mystery that this didn't show up on .NET Core 2.1. MemoryPool<T> did not change significantly between that version and .NET Core 3.1. As far as I can tell, the problem was there all along, but for some reason BenchmarkDotNet doesn't report it.
Removing the unwanted allocations
The solution is to use ArrayPool<T>. This is a less flexible API than MemoryPool<T>: it can only work with arrays, meaning it can only offer memory on the .NET GC heap. But we were using MemoryPool<T>.Shared which turns out to be a wrapper for ArrayPool<T>, so we're really not relying on that flexibility.
The big benefit for us with ArrayPool<T> is that it just hands out the array directly, instead of an intermediary object akin to IMemoryOwner<T>. It doesn't use an IDispose model for returning arrays to the pool—you just pass the array to ArrayPool<T>.Return.
We rewrote the fragment handling code to use ArrayPool<T>, and we saw the per-test-run memory allocation drop from about 13MB to about 30KB. (There are always going to be some allocations. Our goal is to get to an eventual steady state with a marginal allocation rate of 0 for each additional message processed; a few kilobytes to get up and running is fine.) And if we look at it in Visual Studio's .NET Object Allocation Tracking tool, we see a dramatically different picture:
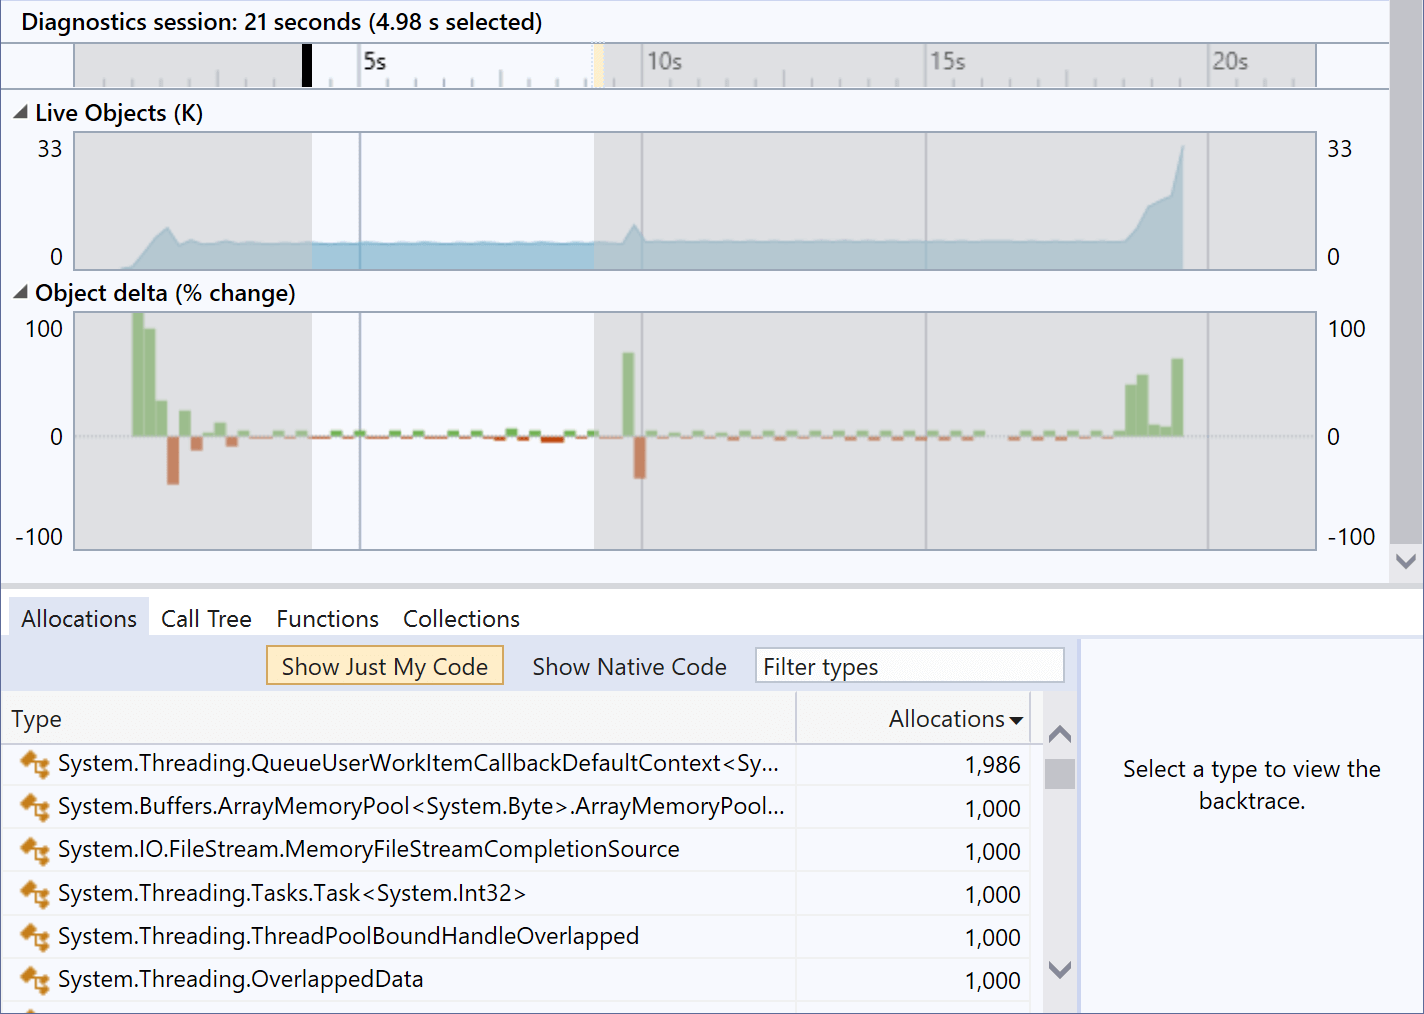
There's still some memory allocation going on, but very little of that is the code under test. The big spike at the start is BenchmarkDotNet getting started. The spike in the middle is BenchmarkDotNet again, as it completes the first of the two benchmarks being evaluated here and starts the second. It's also behind the spike at the end, which is due to the work it does to present the results. The two timespans during which the test is being performed show the heap being very nearly flat. (And the fact that there's some activity here is partly because BenchmarkDotNet is executing multiple test runs one after another.)
You might have noticed that ArrayMemoryPool still shows up here. But upon investigation, it turned out that those remaining instances are all allocated by the System.IO.Pipelines code we're using to read data out of files, so that's not our code doing that. (In any case, each test iteration processes a million AIS messages, so the selected time range shown here covers processing of around 10M messages, and each of those 1,000 objects is tiny, so the pipeline code is working pretty efficiently here.)
Conclusion
As ever, measurement is all important for any performance criteria. The code was operating logically exactly as we had intended, but we had not fully understood exactly was and wasn't being pooled by MemoryPool<T>. Only by inspecting the behaviour was the truth revealed.